
The decline on Friday didn’t quite make the obvious targets on SPX and RUT, though the initial H&S targets were both made. The obvious target on SPX would be a test of established support and the possible H&S neckline at 2085 and that may be tested this morning before the strong rally that looks very likely to come soon afterwards.
On the SPX 15min chart both RSI 14 and RSI 5 sell signals had fixed by the close on Friday. SPX 15min chart:
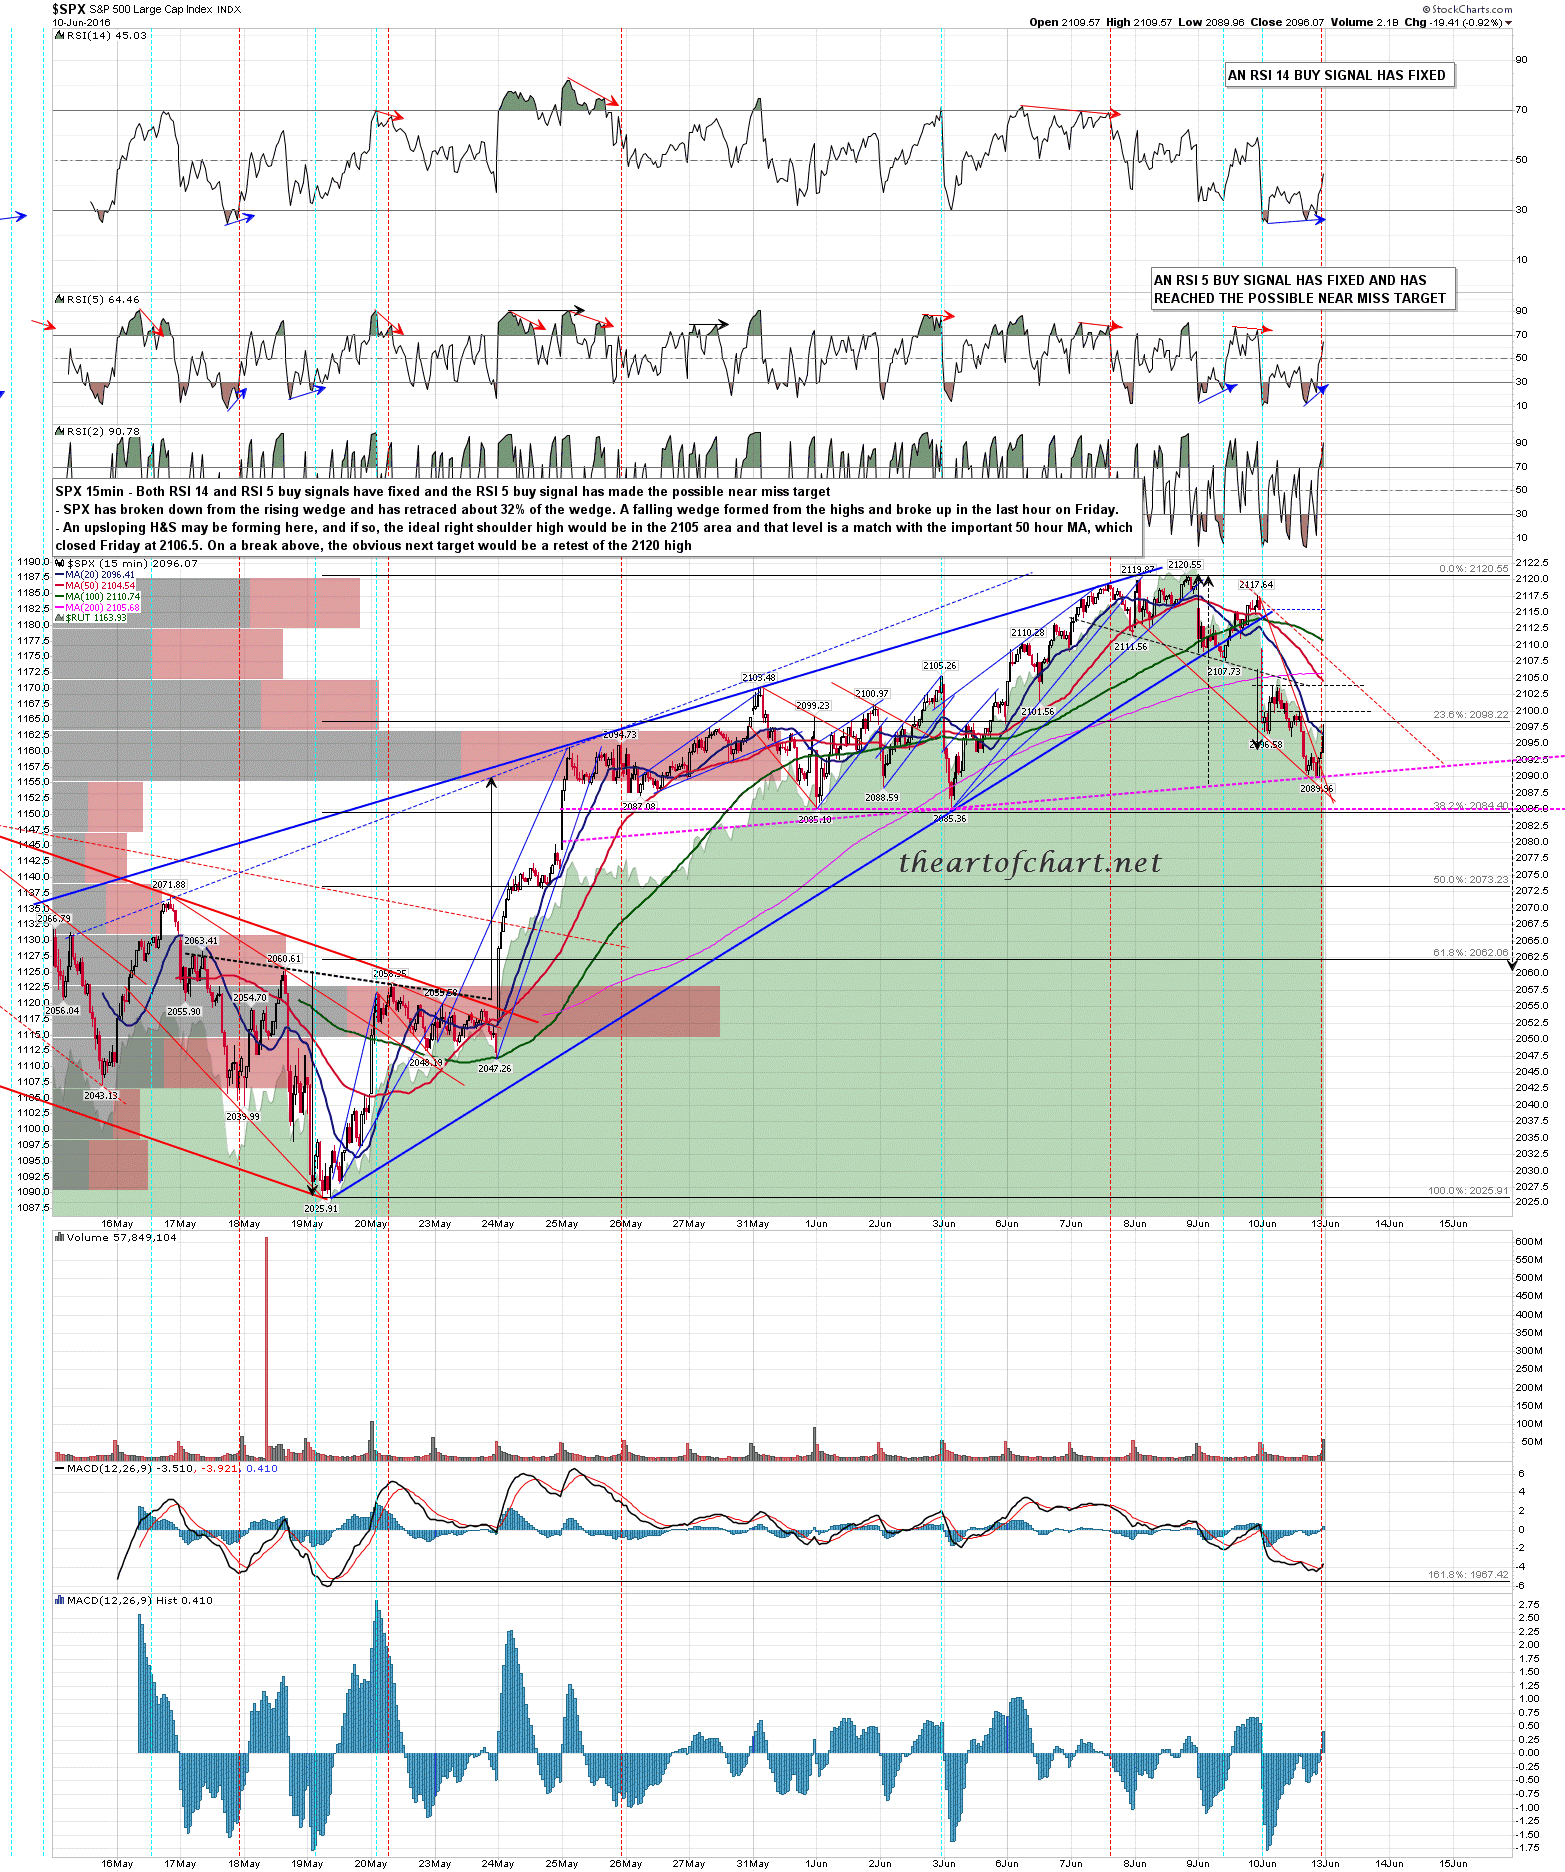
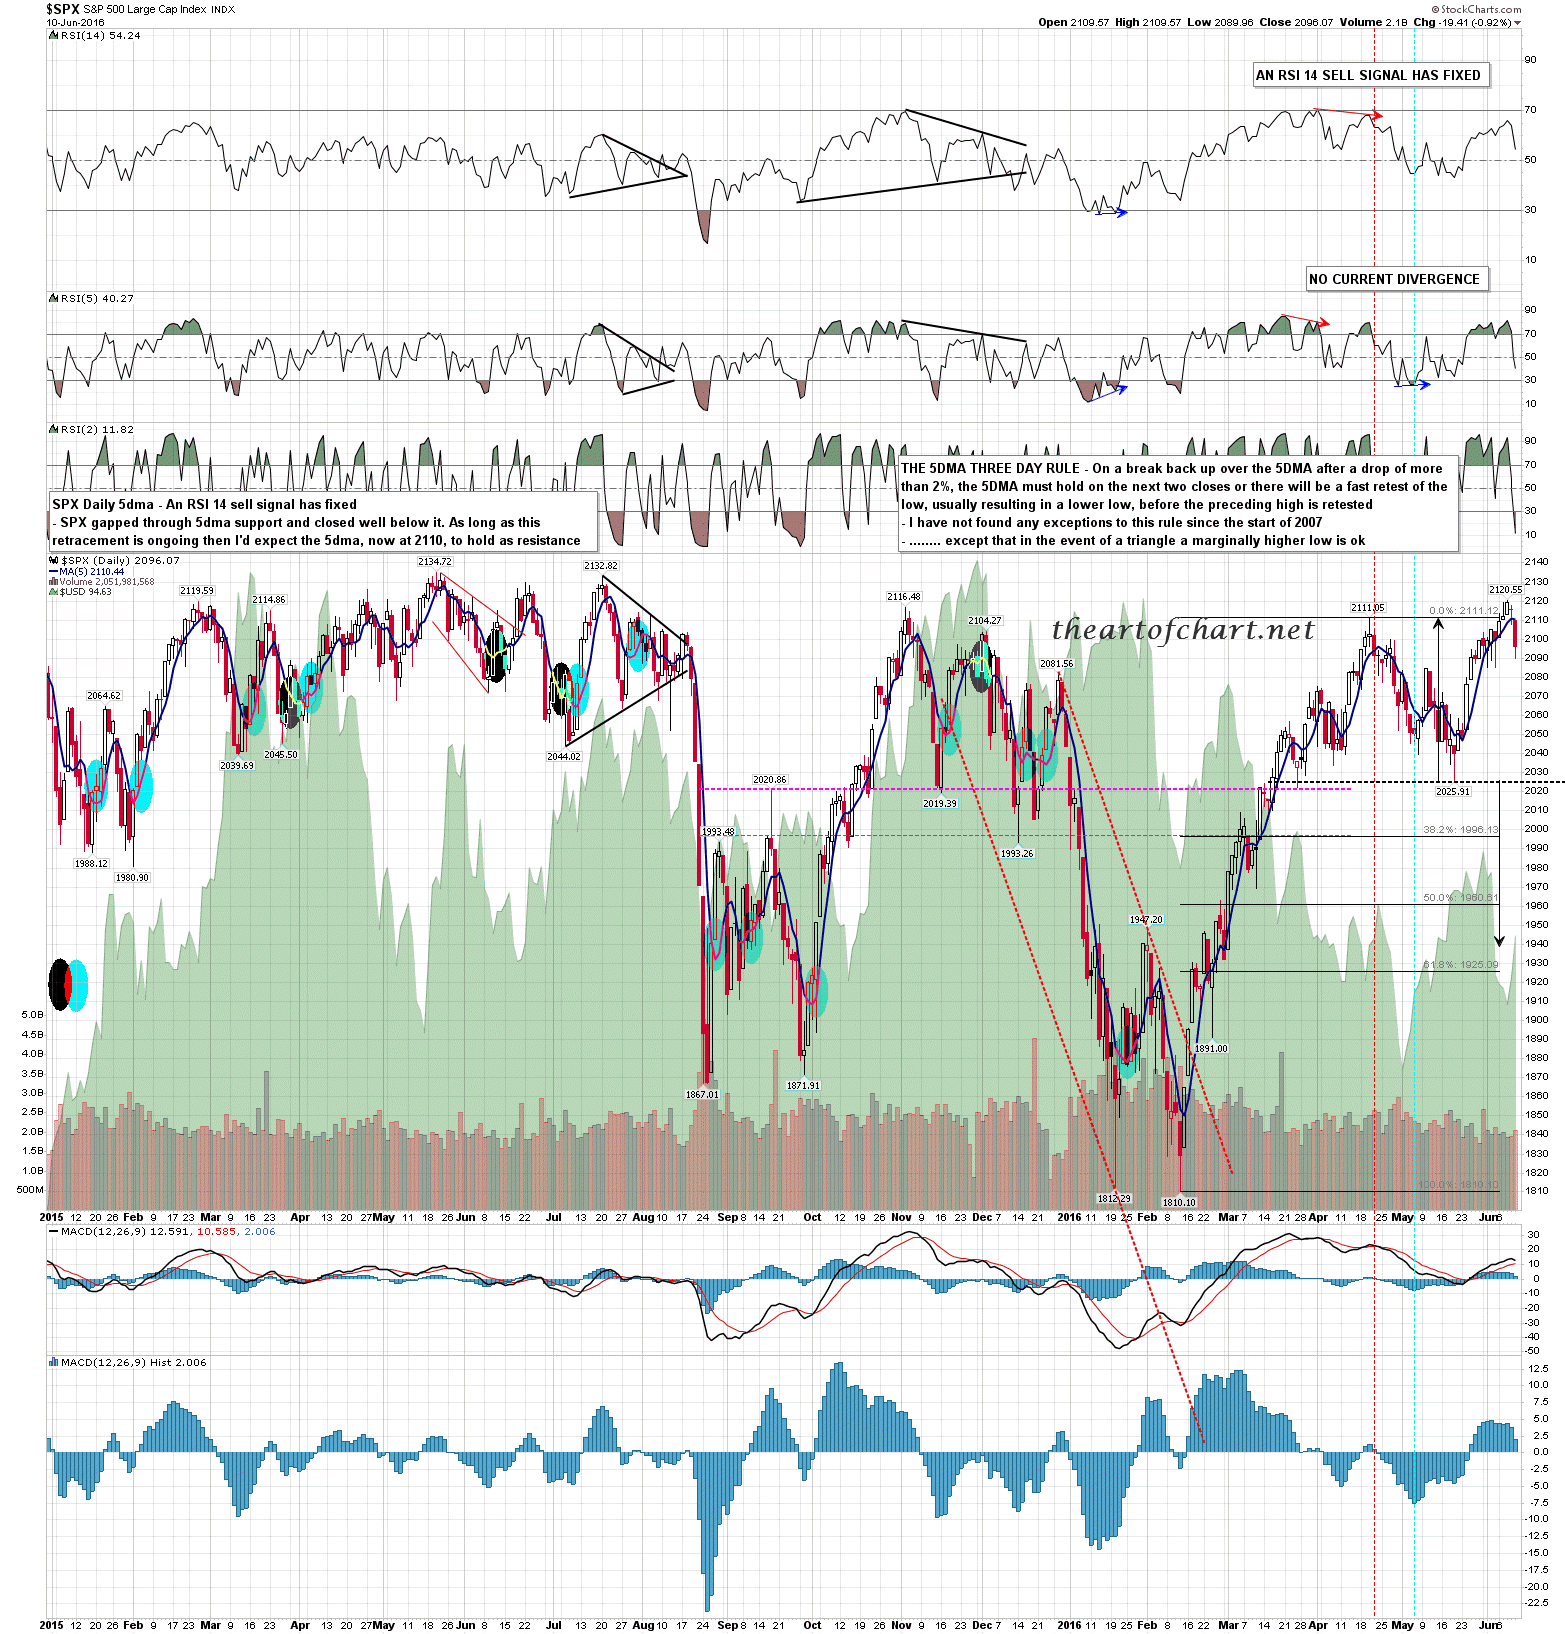
If we see a rally either from the current low at 2089 or a bit lower then the obvious targets would be a retest of the 2106-10 area to retest the 50 hour MA and 5dma from below and make a possible right shoulder on an H&S, or on a break above a retest of the current swing high at 2120, then a marginal new all time high above 2134. Stan and I are leaning towards the third option here, though it could go another way. SPX daily chart:
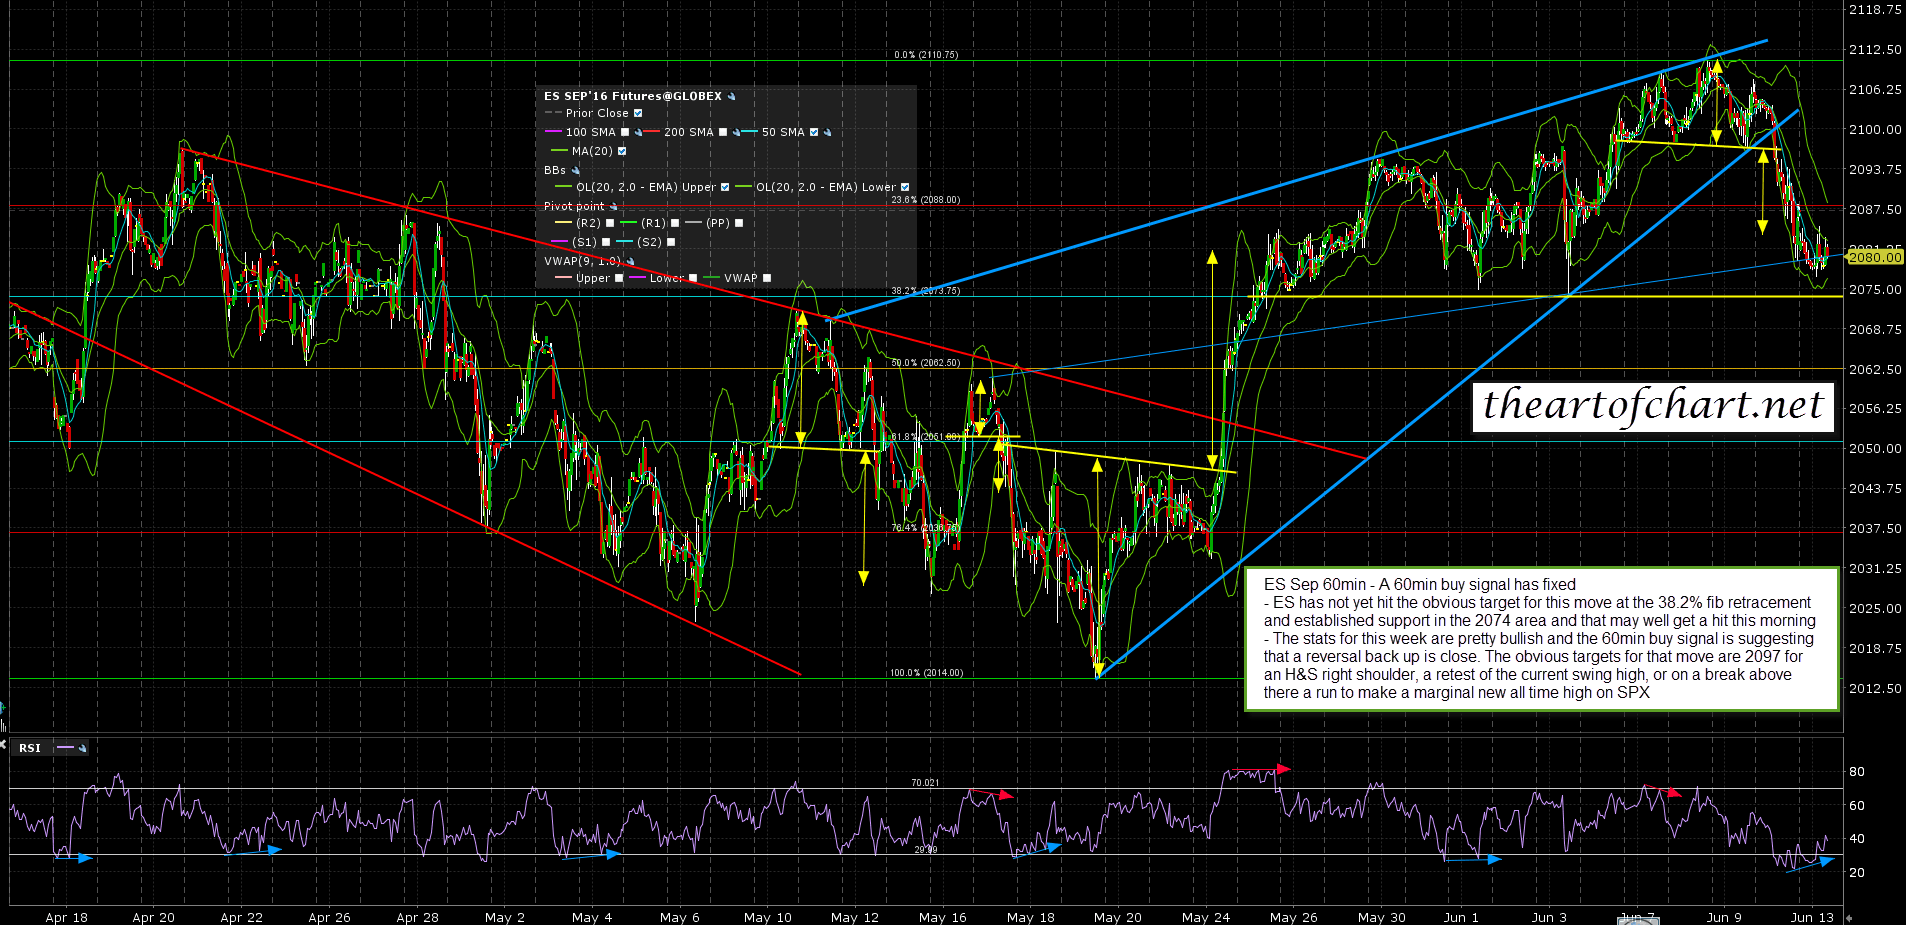
One other thing that is also leaning towards the third option is the 60min buy signal that fixed on ES overnight. There are also now fixed 60min buy signals on NQ and TF. ES Sep 60min chart:
The stats for this week are bullish, with the most bullish stats tomorrow and Wednesday. We should see a rally start today from here or not much lower and that may well make the final high for this run up from the February low. If SPX, NDX and RUT can then break their support trendlines from the February low, we should see a strong retracement with a target on SPX in the mid-1900s before, most likely, going higher.
Stan and I did our monthly public Chart Chat webinar yesterday talking about these and DX, CL, GC, ZB, NG, SB, TLT, GBPUSD, JPYUSD, DAX and others, and if you’d like to see that the recording is posted on our June Trader Education page at theartofchart.net.
