
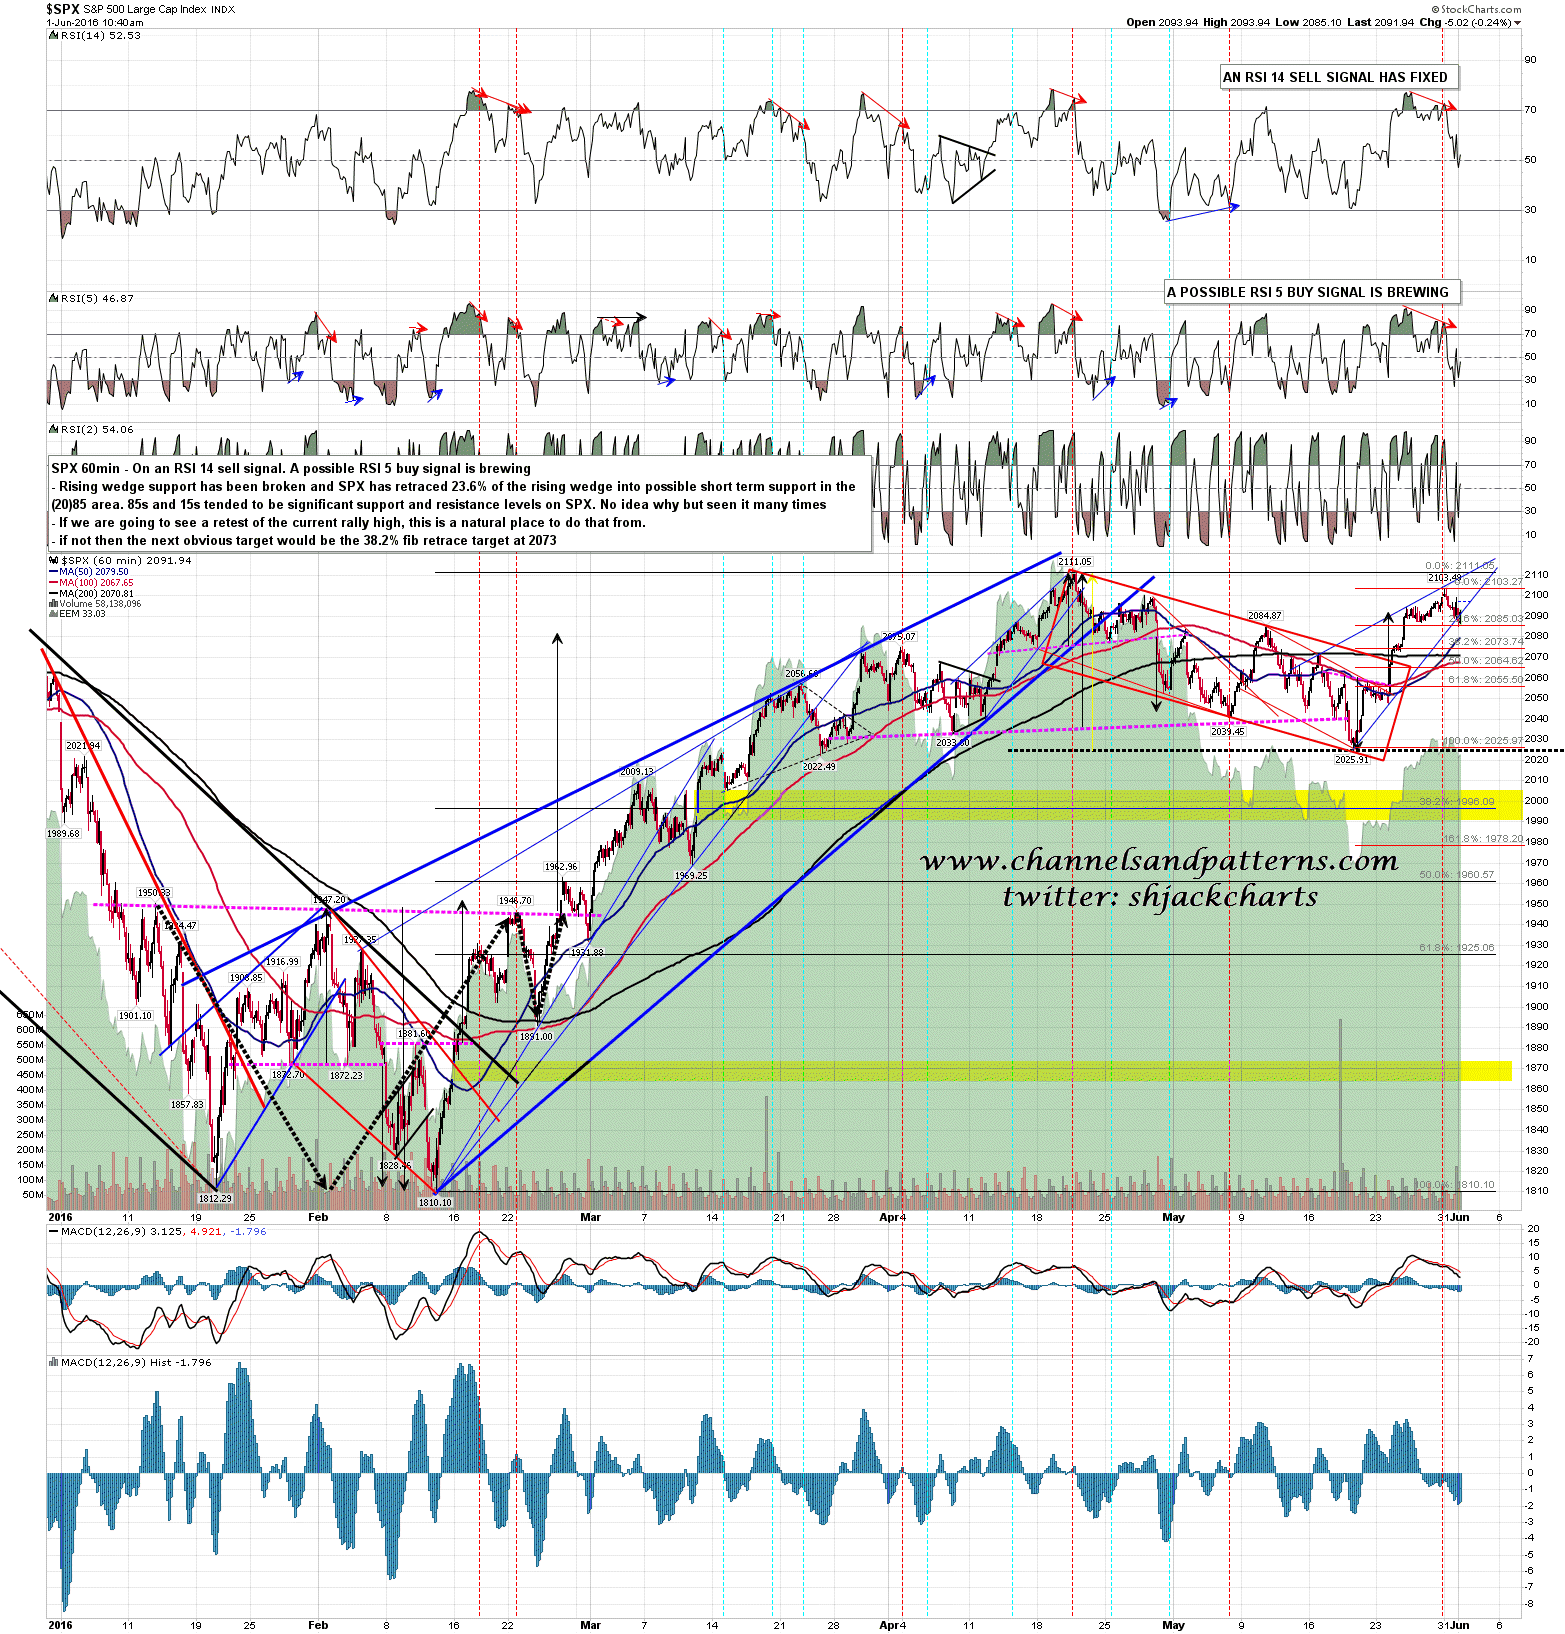
SPX finally delivered some retracement yesterday, the sell signals I was talking about in the morning all fixed, except on RUT, and rising wedge support on SPX was broken. The high for this move may well be in, though I’m very much wondering about a possible retest of the high and marginal higher high here. If so the LOD so far today at 2085 would be a natural place to start that move. SPX 60min chart:
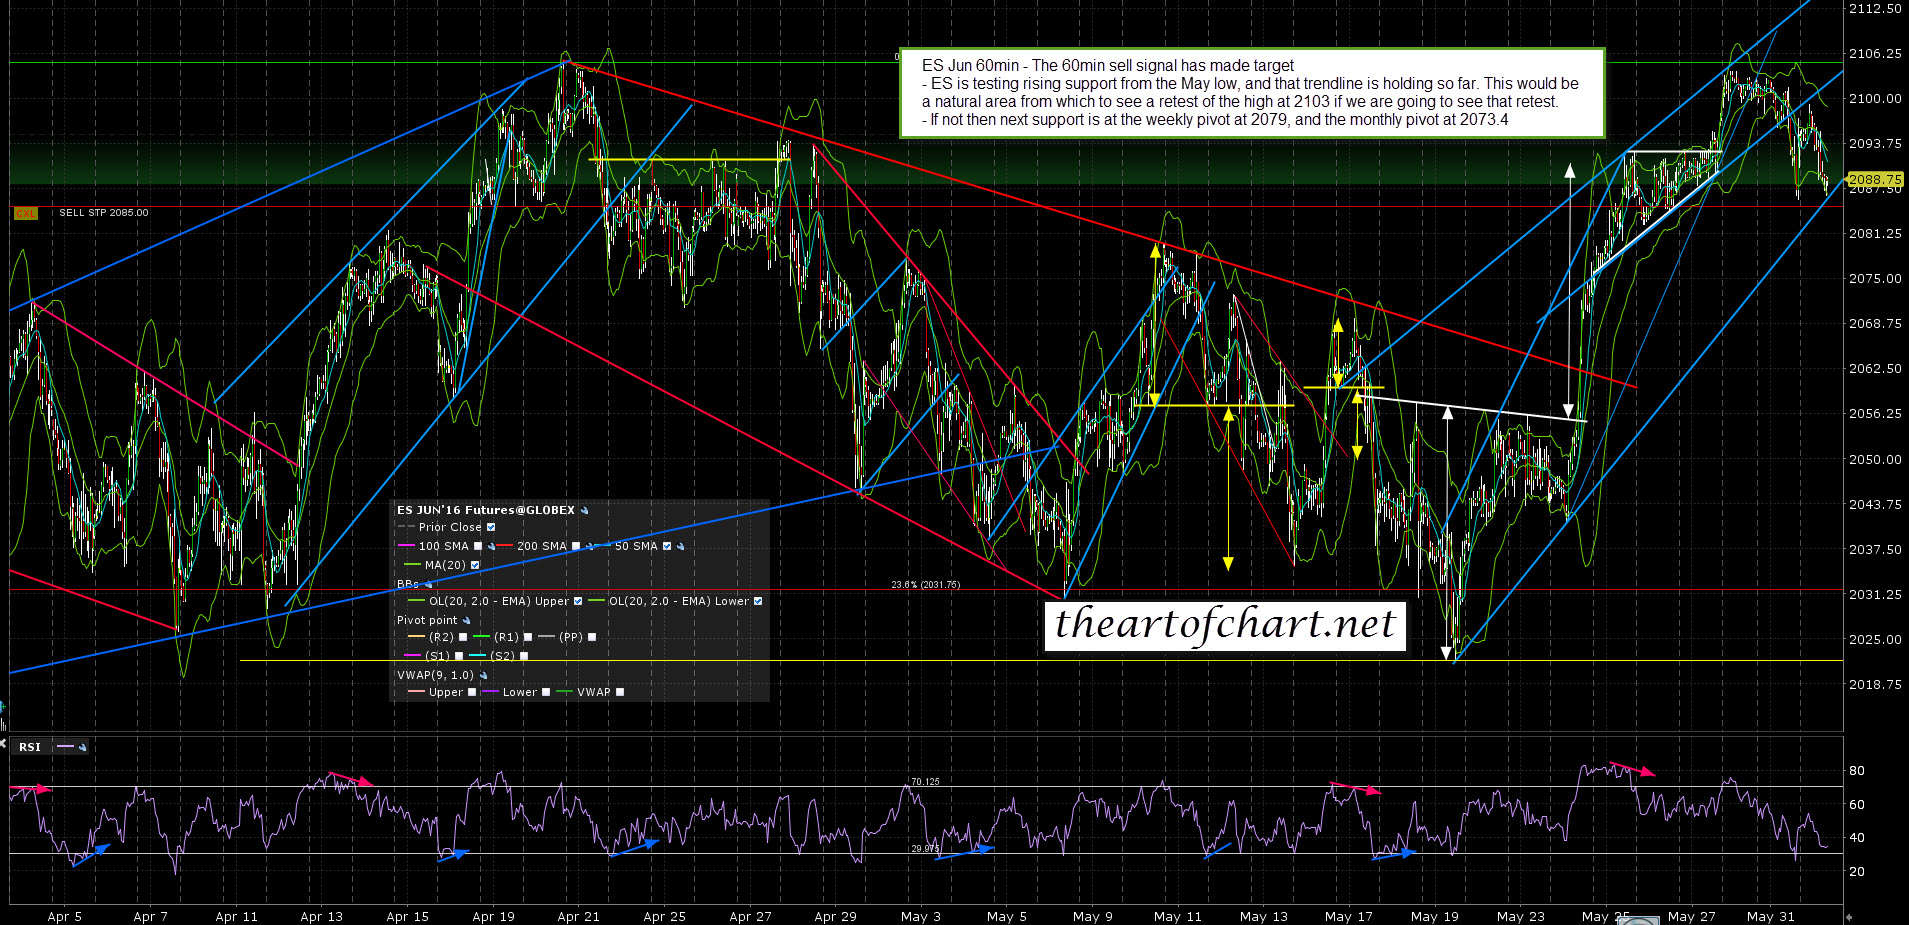
On ES the 60min sell signal fixed rather earlier and there is now a possible 60min buy signal brewing, though there is still an open 60min sell signal on TF. The key level I’m looking at today is 2090 ES or 2092 SPX. If we see a sustained break above with confidence then a retest of the high would be looking good. Otherwise I have marked ES weekly and monthly pivot support in the 2070s on the chart below. ES Jun 60min chart:
Why do I like the high retest scenario here? There are a number of reasons
Firstly there is generally a decent retracement shortly before the high of any move. Anyone who has watched a few of Stan & I’s Chart Chat webinars at theartofchart.net should be familiar with the term ‘low before the high’ or the inverse ‘high before the low’. Yesterday’s retracement is the first decent one we have seen.
Secondly the stats for the first trading day of June are strongly bullish, with green closes on Dow on 20 of the last 27.
Thirdly RUT broke the 60min negative RSI divergence yesterday, which is the reason that there is no 60min sell signal on RUT. A retest of the high would likely re-establish that divergence and might well set daily RSI 5 sell signals brewing on SPX and other indices. This may be a very significant high so I’d normally expect to see those, though far from always.
Cycle trend days are unreliable this week due to the holiday weekend but for what it’s worth today is a cycle trend day. We’ll see how that goes today.
