
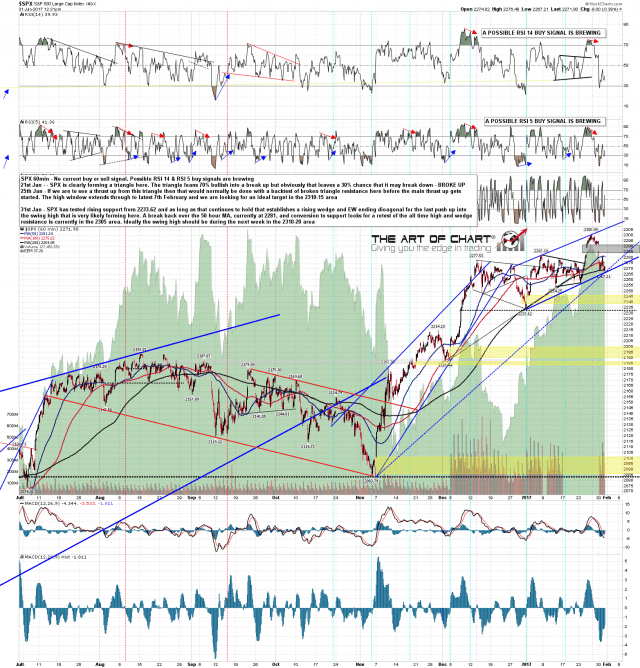
Our primary scenario here is that this is likely to be the last retracement before a likely swing high to be made over the next few days. At the moment that’s looking pretty good, with the retracement low at rising support from the 2233 and the low this morning has confirmed a rising wedge on SPX for this current move, and a rising channel on ES. On a break back over the 50 hour MA on SPX, currently at 2281, there would be a double bottom breaking up with a target in effect at the all time high. We’d be looking for a rejection at that retest in the second high of a double top looking for a return to the possible H&S neckline at 2233, or continuation up to rising wedge resistance, ideally to be hit in the 2310-20 area within a week or so. We’re favoring the higher scenario at the moment. This rising wedge on SPX is of course also an Elliot Wave ending diagonal, which is the ideal pattern to finish this move up.
I was looking at the setups on ES, NQ & TF in my premarket video for Daily Video Service subscribers at the artofchart.net this morning, and you can see that here. The ES, NQ & TF charts from that video are below the SPX chart and I’ll talk about what has happened on each relative to my expectations in the premarket video.
SPX 60min chart:
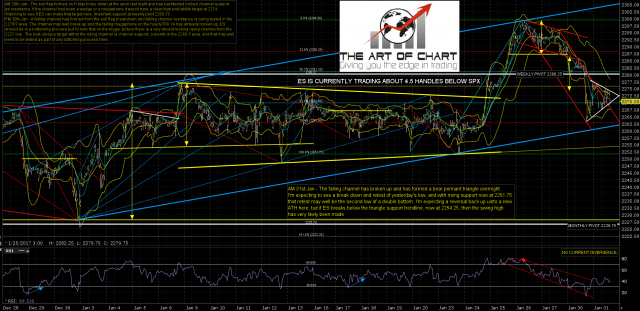
ES has done exactly what I was looking for this morning with the bear pennant breaking down into a marginal lower low this morning at the rising support trendline. A 60min buy signal is brewing and as long as that low holds the next move to a new (and final for the moment) ATH should be starting here. ES Mar 60min chart:
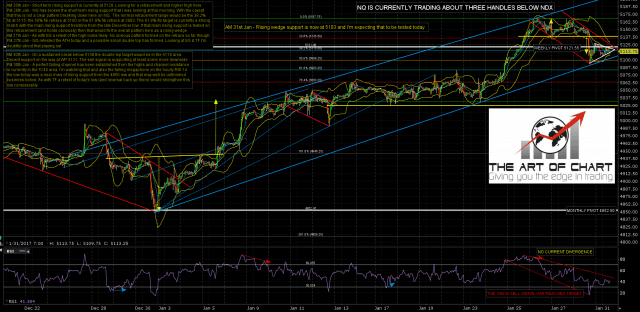
I was sceptical in the video about rising wedge support on NQ holding and NQ broke down into the 61.8% fib retrace target. That puts NQ in a likely topping process here and means that NQ is unlikely to manage much more than a retest of the all time high. On the plus side for bulls short term that does mean that a 60min buy signal is now also brewing on NQ, which wouldn’t have been the case if that support trendline had held. NQ Mar 60min chart:
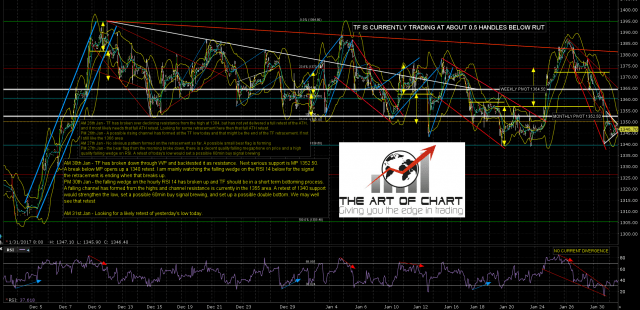
On TF 1340 has to be very solid support and that hasn’t been tested this morning. Until we see a break back over 1360 we might still see that retest. TF Mar 60min chart:
As long as the low this morning holds, this low on both SPX and ES is at the obvious level to see a final move up start here, and that’s what I’m expecting to see. The key resistance levels on each are the 50 hour MA on SPX, currently at 2281, and the weekly pivot on ES at 2280.25.
If this low on SPX and ES doesn’t hold then the odds that the swing high is already made will rise considerably. On a break below 2254 ES it would very likely be in. That would be the lower probability scenario here but they happen, just less often than the higher probability scenarios. 🙂
Stan and I are doing our monthly free public Chart Chat webinar on Sunday which is good timing to review how this swing high is progressing. If you’d like to attend I’ll be posting the link to register for that tomorrow morning.
