
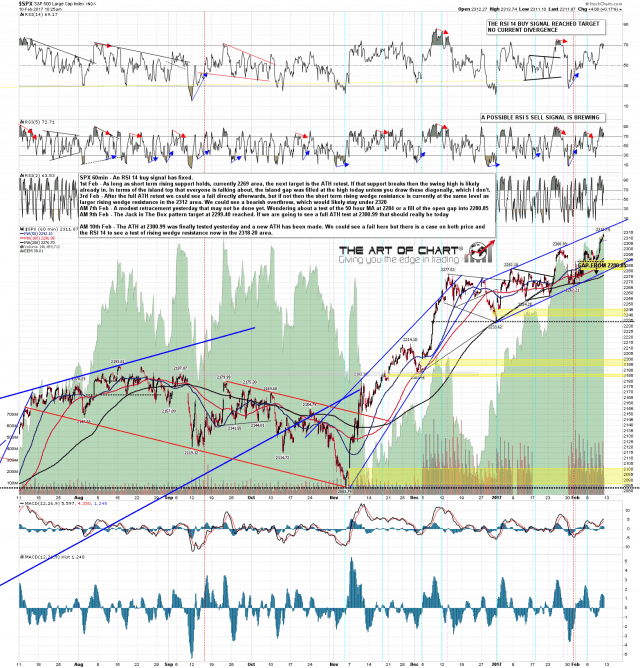
SPX retested the high and has made a new all time high with enough confidence that I am looking seriously at the next trendline target in the 2318 area. This is the resistance trendline on the rising wedge from the start of January. SPX 60min chart:
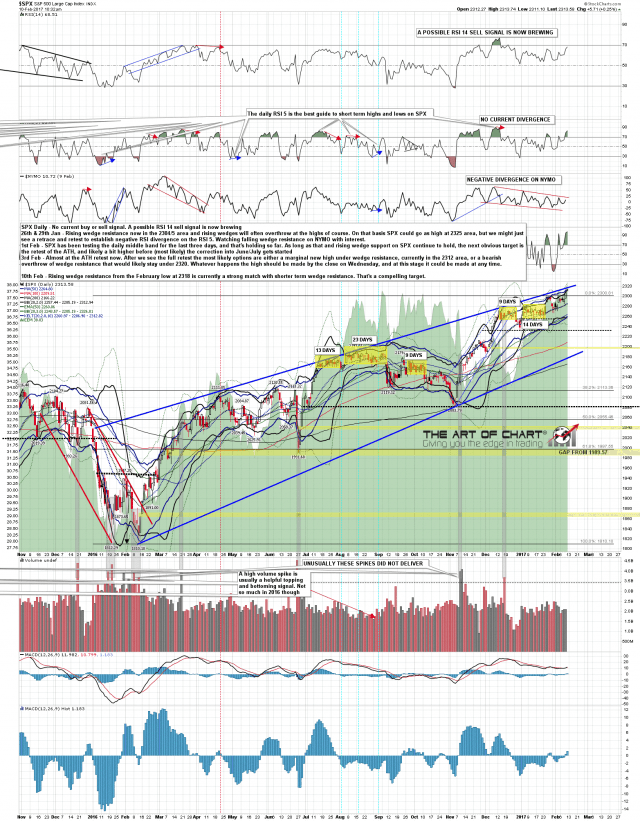
What makes this a particularly compelling target is that it is a close match with wedge resistance on the much larger rising wedge from the February 2016 low. SPX daily chart:
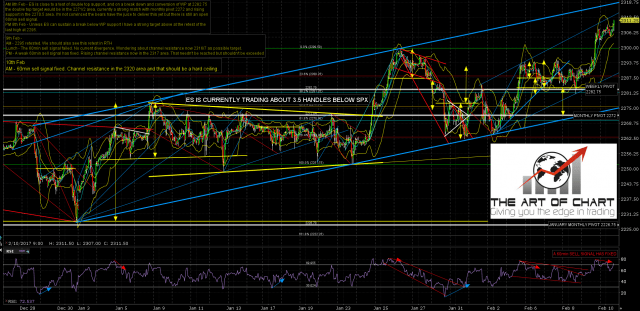
If reached the wedge might overthrow that level slightly, but I’d expect ES rising channel resistance in the 2318 area (about 2321/2 SPX area) to be a hard ceiling that shouldn’t be broken, though it may need to be tested. A 60min sell signal fixed overnight. ES Mar 60min chart:
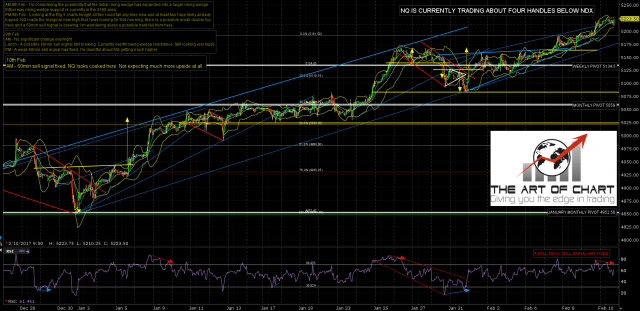
NQ looks cooked here. Not expecting much more upside. A 60min sell signal has fixed. NQ Mar 60min chart:
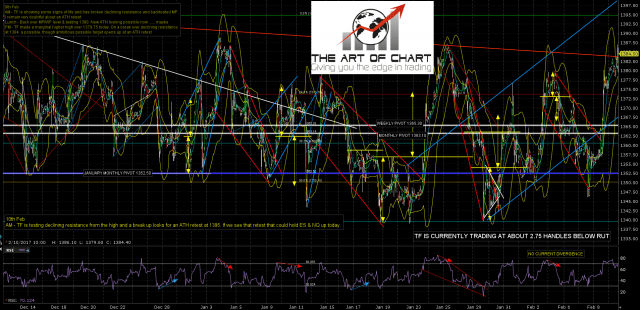
TF is trying to retest the ATH and may make it yet. Regardless, a 60min sell signal is now brewing there. TF Mar 60min chart:
Ideally SPX/ES hit these targets at the highs today and we see a gap down on Monday to start the expected correction. Everything is in place for that now and it should be starting imminently. We’ll see if it does. As ever I’d note that these forecasts are made with math rather than magic and that if there is such a thing as a certainty in trading, I have yet to see it. Nonetheless math tends to do ok. Next post is on Wednesday morning & everyone have a great weekend 🙂
