
A new ATH at the open this morning but under the hood there were some telling signs of short term weakness both yesterday and in the subsequent move this morning. Yesterday there were some minor trendline support breaks, on the daily chart SPX failed to test the daily upper band, and some sell signals fixed on the SPX hourly chart. When I was doing this chart though I was looking at key short term support at the perfect rising channel from February 8th at 2360.5, and that has now broken, putting SPX in a likely short term topping process, though Stan and I don’t think that the swing high is in yet. SPX 60min chart:
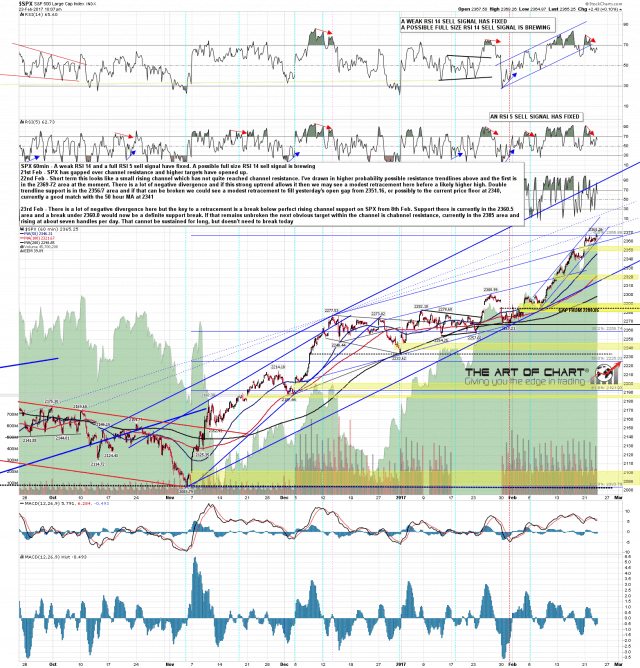
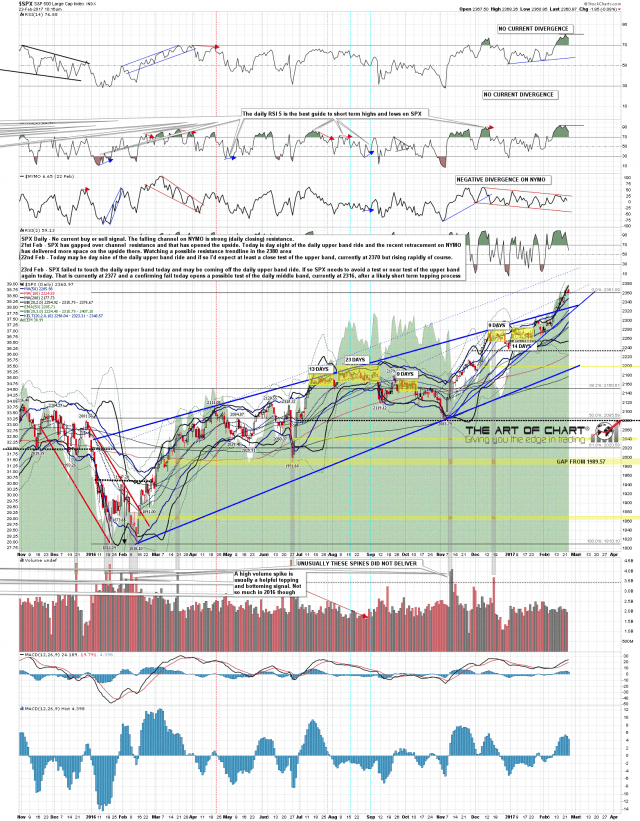
SPX came off the daily upper band ride yesterday. This needs a confirming second day without a test of the daily upper band, currently at 2377 and rising at about seven handles per day. If the band ride is over then SPX is likely in a topping process that should resolve into a test of the daily middle band, currently at 2316 but also rising of course. SPX daily chart:
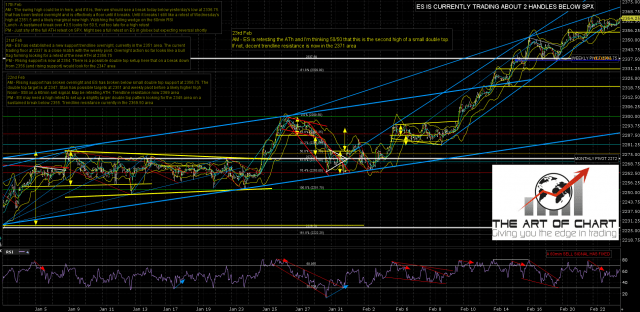
There is a decent looking little double-top here on ES and on a break below 2355 the alternate targets for this asymmetric double top at 2345 or 2342.25. That could deliver a test of the weekly pivot at 2337.75. This could fail in a Jack In The Box continuation setup though and as Stan is treating this as a flat with the next downside target in the 2352 area, there is a very significant risk of a test of the 2352 area and a sharp reversal from there back up to retest 2367.75. ES Mar 60min (pre-market) chart:
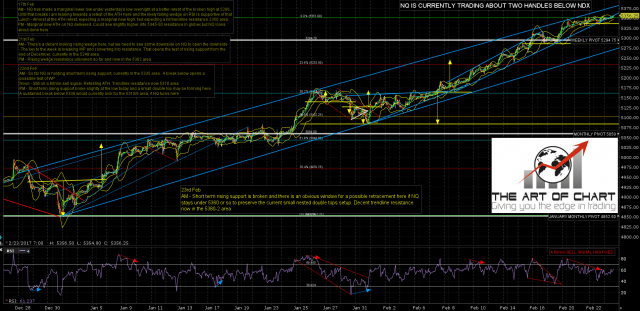
NQ has broken down from the double top and made the double top target at 5315/6. The 60min sell signal there has made target and I’d also note that the first of our Big Five components to break support hard is TSLA gapping down through important trendline support this morning. More needed on NQ but that’s a signal that the wind is starting to change. NQ Mar 60min (pre-market) chart:
TF has tested the possible target at 1386 that I was looking at in the pre-market. That is an established support area and possible H&S neckline that I’m watching with interest. TF Mar 60min (pre-market) chart:

The day is still young but the bears have already done enough damage today to suggest that the trend wind might be starting to change. The swing high most likely isn’t made on SPX yet though and SPX may be retesting this morning’s high before long. I’m watching to see whether the bears can deliver a decent red candle today. Stan’s 2352 flat target is suggesting that they may not manage that today, but the action so far today considerably improves the odds that they’ll manage a larger reversal soon.
Stan and I are doing two free webinars this week at theartofchart.net and did the first one last night on the Big Five – AAPL, AMZN, FB, NFLX and TSLA. The recording is posted on this page here. The second free webinar this week is an hour after the close tonight and is a second webinar on ‘Technical Patterns You Can Profit From’ following on from the first one in January. As always the TA will be world-class and the subject matter will be interesting so if you’d like to see that you can register it on this page here.
