
Wednesday is my busiest day of the week and I didn’t manage to get a post out yesterday. I am going away for the weekend and may not manage to get one out tomorrow either, so I’m making today’s post as comprehensive as possible. Before the RTH open today I tweeted the premarket video I recorded this morning for Daily Video Service subscribers at theartofchart.net & you can see that here. If you trade USD, oil, natural gas, gold or treasuries then updates for DX, CL, NG, GC & ZB are included in the video as well.
On the 60min chart SPX confirmed a small rising wedge from the 2233 low on Tuesday and as and when that rising wedge support breaks the swing high here will likely be in. That’s been retested this morning and is holding so far. As long as that remains the case the next obvious target on SPX is a retest of the all time high. Whatever happens we are looking for this swing high by the close on Wednesday 8th February. SPX 60min chart:
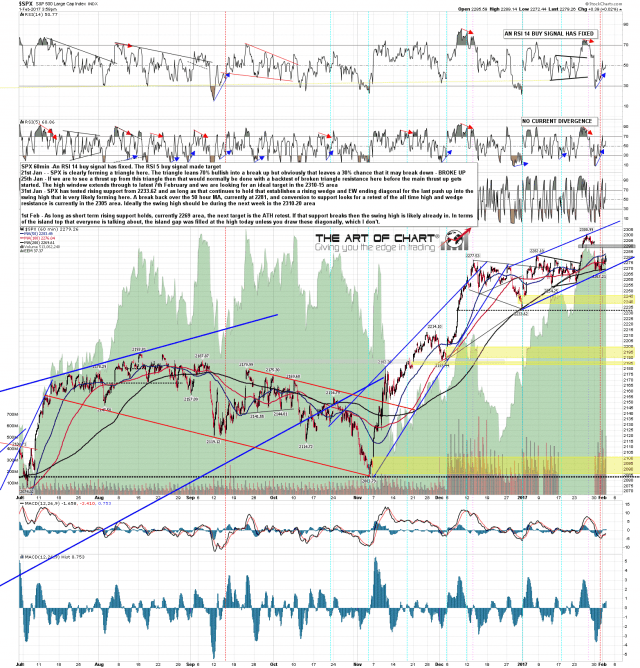
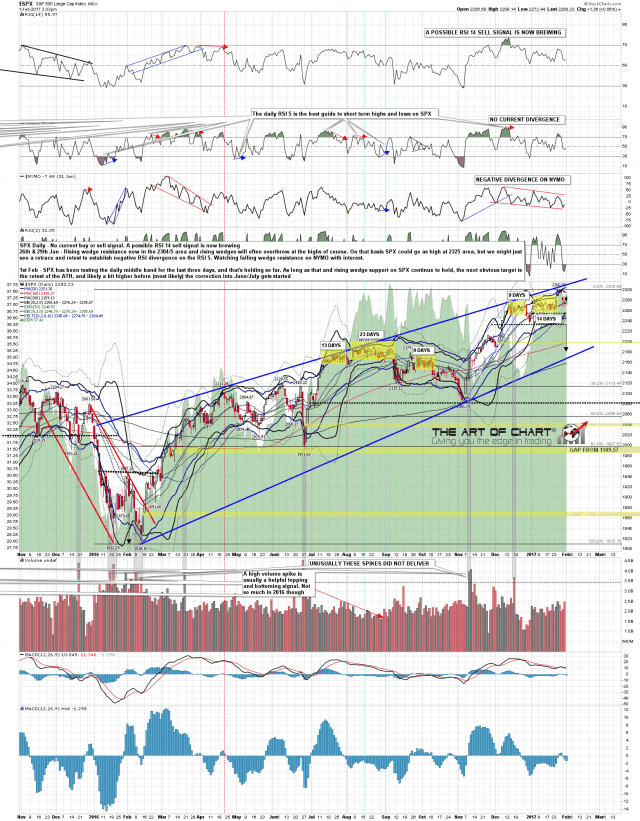
On the daily chart the key support level is the daily middle band (daily close basis). That’s currently at 2276.5 and bears have been unable to sustain trade below it into the RTH close so far this week. Worth noting on this daily chart is strong wedge resistance currently in the 2308 area. That doesn’t need to get a test here, though a lot of highs are made on bearish overthrows of wedge resistance. SPX daily chart:
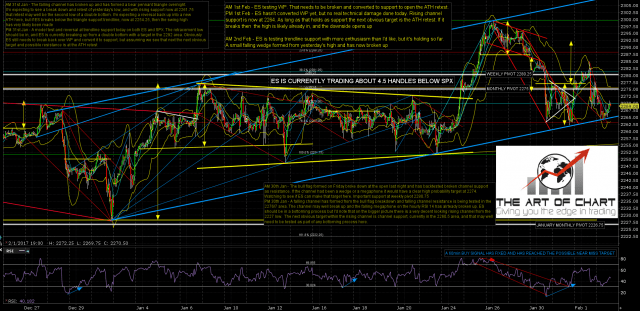
ES tested rising channel support overnight and it held. The test was more enthusiastic than I’d have liked and I’d prefer to not see that support trendline tested again until after the ATH retest. It’s a market truism that the more often a level is tested, the more likely it is to break, and unlike some other market truisms, that one is absolutely right. ES Mar 60min chart:
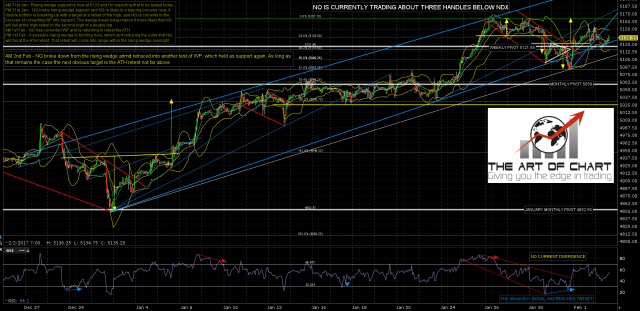
I’m concerned about NQ here. That’s not because I am doubting that we see a full ATH retest on NQ, as I think that’s very likely. My concern is that this setup is suggesting that NQ might fail hard at that retest, and given that NQ is much closer to the ATH retest than ES or TF, that might mean that the ATH retest move on SPX might be derailed at that point. I mention on this morning’s video that I don’t share the complacency of many commentators that AAPL and FB will continue powering up here. They have reached the obvious upside target areas for this move and my working assumption is that both are close to significant highs, in what are likely to be the second highs on sizeable double top patterns. We’ll see. NQ Mar 60min chart:
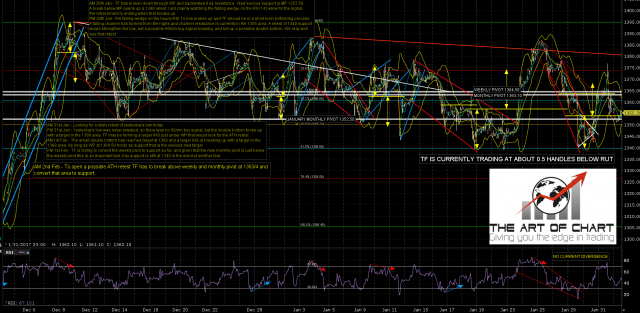
TF is the weakest of the three. Clear resistance at 1363-5 and if that can’t be converted to support this week the ATH retest there is likely a write-off. TF Mar 60min chart:
Subject to any issues with weather or plane schedules I should be back in plenty of time for the free to all public Chart Chat that Stan and I are doing on Sunday. If you’d like to attend then you can register for that on this page here. Markets are looking interesting almost across the board at the moment so it should be a very interesting review.
If I don’t manage to get a post out tomorrow, everyone have a great weekend. 🙂 – If I don’t do a post tomorrow I’ll be tweeting a couple of brief updates on my public twitter feed.
