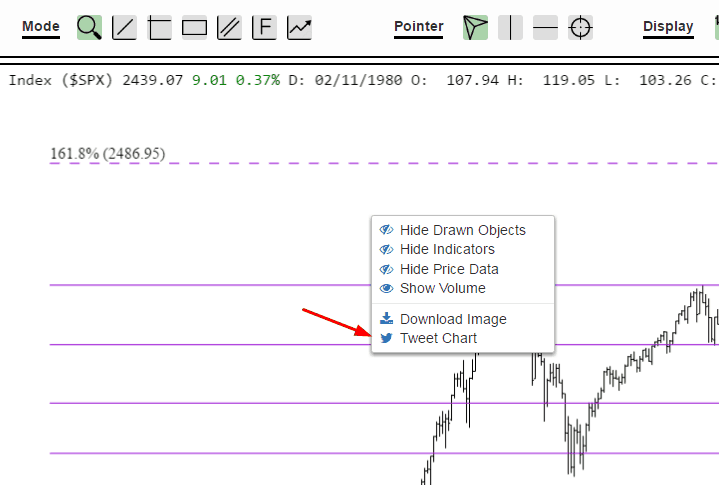
Another weekend has passed, and that means the SlopeCharts elves have been hard at working making the product better. The latest improvement is the ability to tweet any chart to your followers. Just right-click anywhere on the chart and, voila, instantly send it to everyone following you on Twitter!
Slope of Hope Blog Posts
Slope initially began as a blog, so this is where most of the website’s content resides. Here we have tens of thousands of posts dating back over a decade. These are listed in reverse chronological order. Click on any category icon below to see posts tagged with that particular subject, or click on a word in the category cloud on the right side of the screen for more specific choices.
Kathy Nixed the Video
For years, I have had a fantasy about creating a video based on the famous milkshake scene from There Will Be Blood. In case you are unfortunate enough not to be familiar with it, here it is:
Crude Oil’s Sweet Spot
The long-term chart below of Crude Oil shows a potential reverse Head & Shoulders pattern that has formed since the end of 2014, with a high-level tug-of-war occurring above the light green shaded area (just above a 78.6% Fibonacci retracement level and within the upper half of a declining channel) at 43.50 since mid-2016.
At the moment, we see major indecision around the 50.00 level (50 & 200-day moving averages).
A breakout and hold above the reverse H&S pattern neckline around 57.00 would be significant, inasmuch as we see a confluence of major Fibonacci, channel, and price resistance at that level. I’d call that Oil’s sweet spot.