
After a memorably boring four day range consolidation Tuesday through Friday last week, SPX finally broke up and tagged 2500 at the close on Friday. This should follow through to the upside, short term at least, and I have some targets to watch, and a warning that this move over 2500 may well not last the week.
On SPX the obvious trendline target is rising wedge resistance, currently in the 2514 area, and a strong match with rising wedge resistance on the ES chart. On the daily chart (not shown below), there is a possible RSI 5 / NYMO sell signal brewing, but the negative divergence is slight and might well be lost on a green close today or tomorrow. SPX 60min chart:

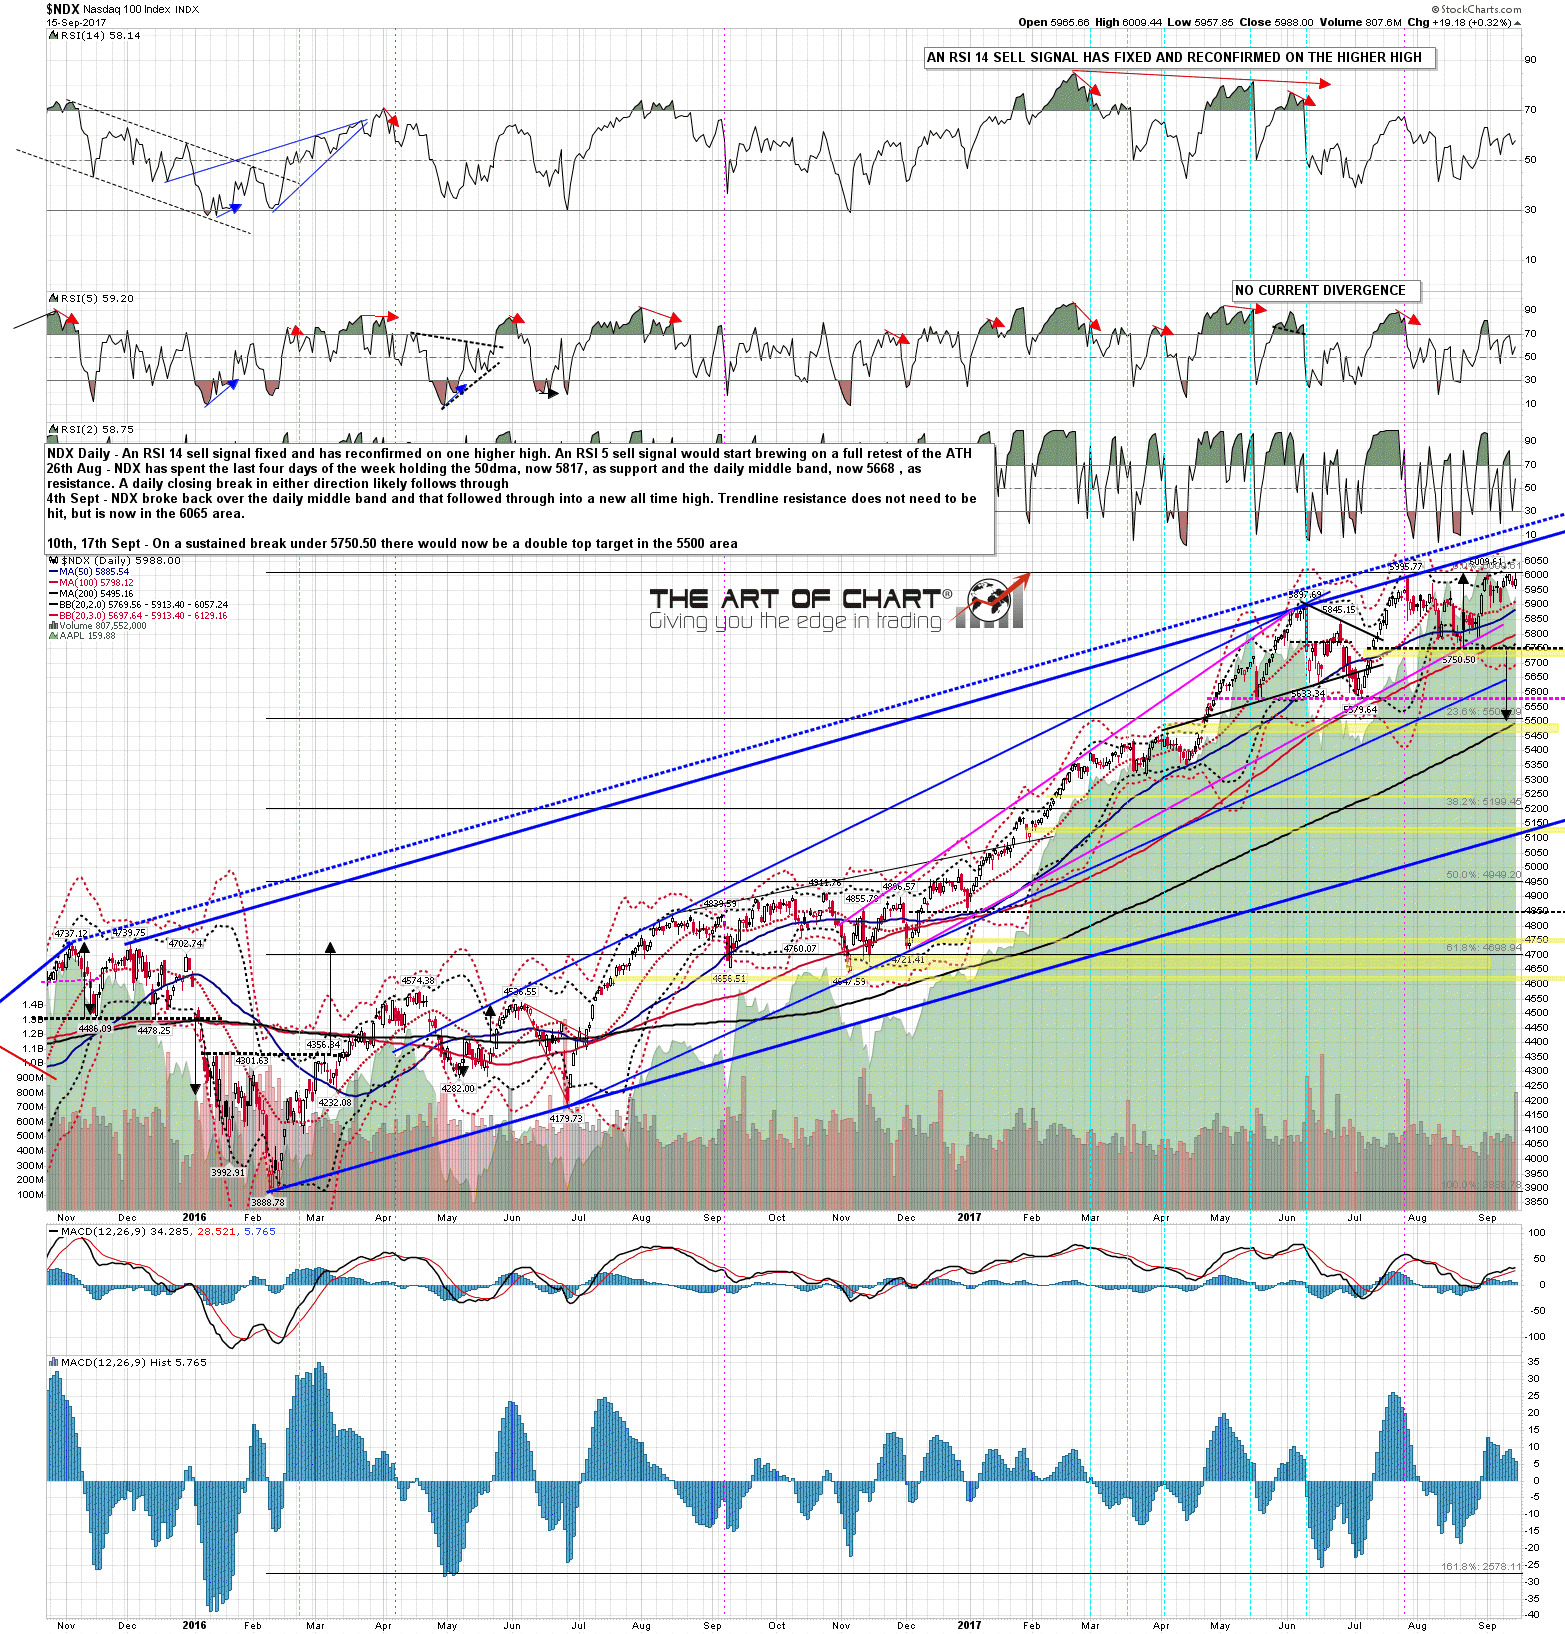
On NDX (and RUT) there is a more robust looking daily RSI 5 sell signal brewing and there is a possible nested double tops setup forming here that might deliver a strong rejection near the all time high retest, though I’d be surprised to see that rejection before NQ reaches the bull flag target at the all time high retest there at 6025. NDX daily chart:
On RUT there is another robust looking possible daily RSI 5 sell signal brewing. The obvious target above is the retest of the all time high, but unless RUT can start to outperform SPX and NDX this week then I’m doubtful about that being reached. Maybe. RUT daily chart:

The ES, NQ and TF futures charts below were done two hours before the RTH open for Daily Video Service subscribers at theartofchart.net. If you are interested in trying our services a 30 day free trial is available here.
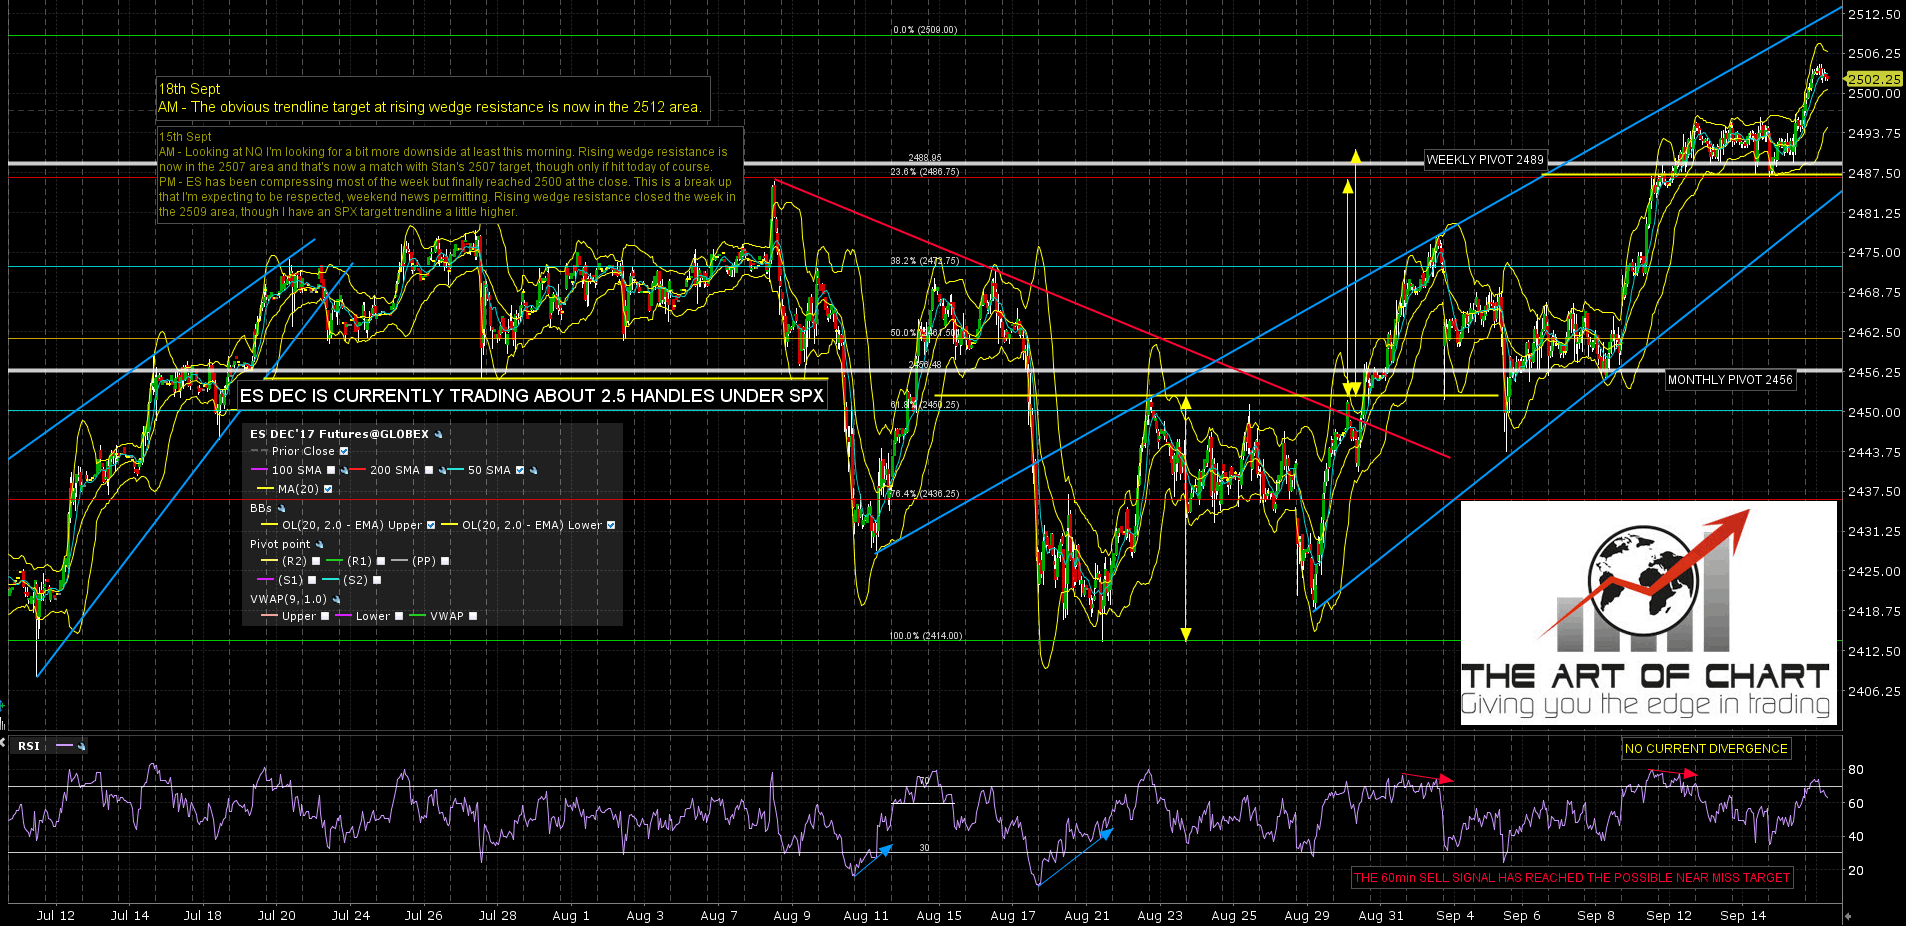
On ES the obvious trendline target above is rising wedge resistance, now in the 2512 area and a strong match with the trendline resistance on the SPX chart. ES Dec 60min chart:
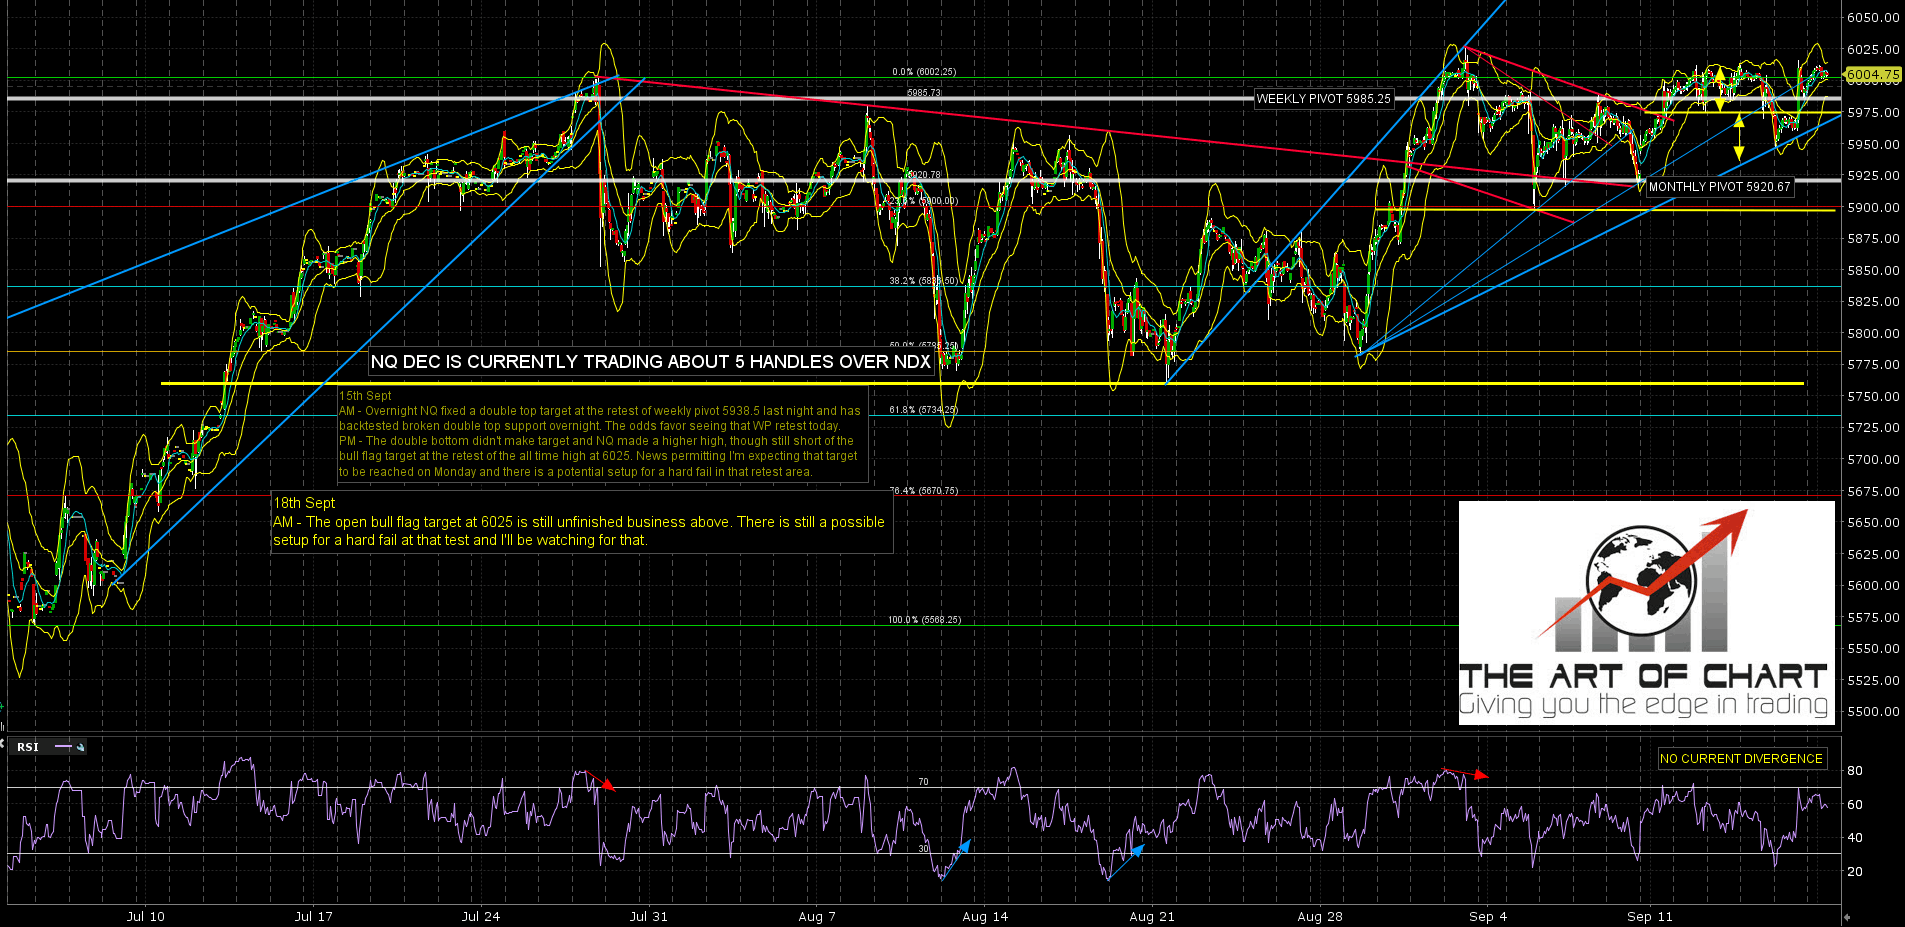
On NQ there is unfinished business above at the fixed bull flag target at retest of the all time high at 6025. Not expecting a serious reversal before that target is hit but we may see one not long after it is. NQ Dec 60min chart:
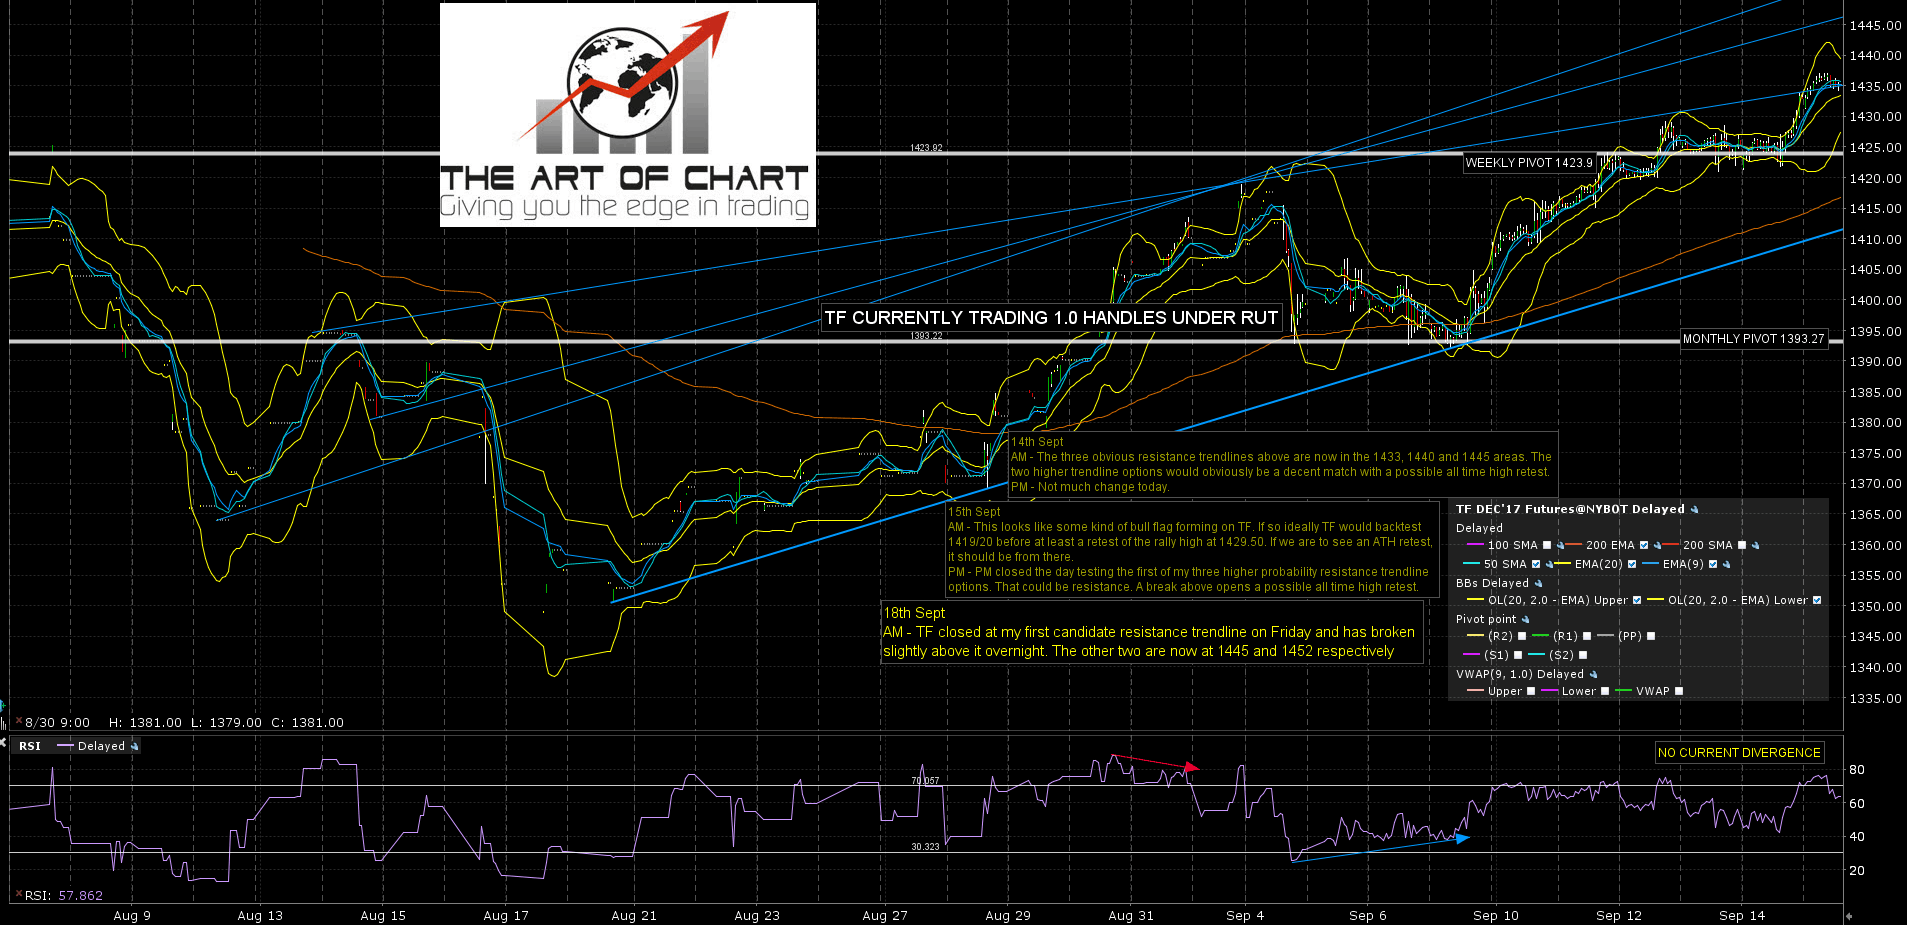
TF reached the first of my three higher probability candidate resistance trendlines at the close on Friday and has broken slightly higher overnight. If TF can reach the next one up that is now in the 1446 area. TF Dec 60min chart:
Ideally looking for a high by Wed/Thurs this week that delivers at least a retracement into the rising wedge support trendline from the Feb 2016 low, currently in the 2390 area, and lower if that support breaks. We’ll see how that goes. 🙂
