As far as I’m aware the only nonsense word from Lewis Carroll’s Jabberwocky to make it into general usage was ‘galumphing’ a wonderful word evoking something large and ungainly achieving speed without grace. Still a favorite word of mine, though not one I get a chance to use often.
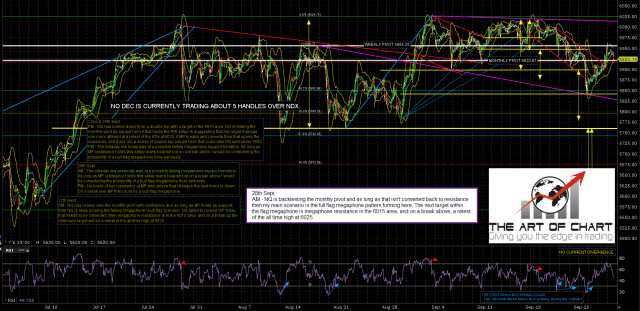
NDX has reversed back up on a setup I show on the NQ daily chart below, and the obvious read is that NDX is galumphing back to a retest of the all time high, though NDX still looks heavy and might fail to deliver on that.
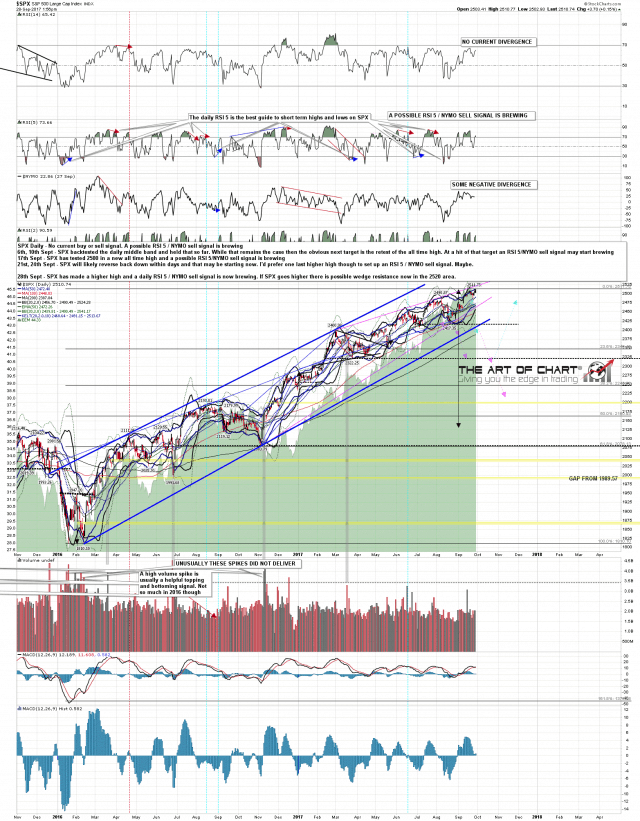
In the meantime SPX delivered a higher high and the possible daily RSI 5 / NYMO buy signal that I was hoping to see start brewing on a higher high is now brewing, and should fix as an when this move up tops out. SPX daily chart:
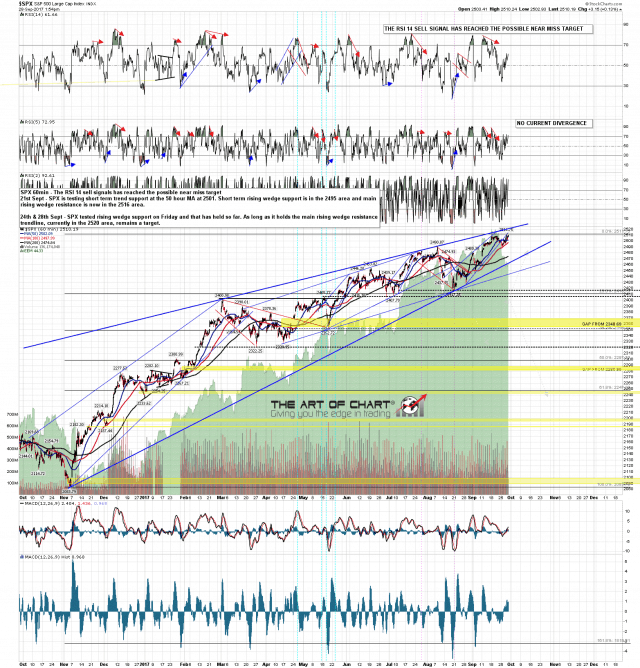
So where will this move top out? Well there is likely unfinished business above at the rising wedge resistance trendline now in the 2520 area. I’ve mentioned that before and that is no far away now. Wedges can overthrow, so Stan is thinking that an overthrow could potentially go as high at 2529. SPX 60min chart:
The ES, NQ and TF futures charts below were done two hours before the RTH open for Daily Video Service subscribers at theartofchart.net. If you are interested in trying our services a 30 day free trial is available here.
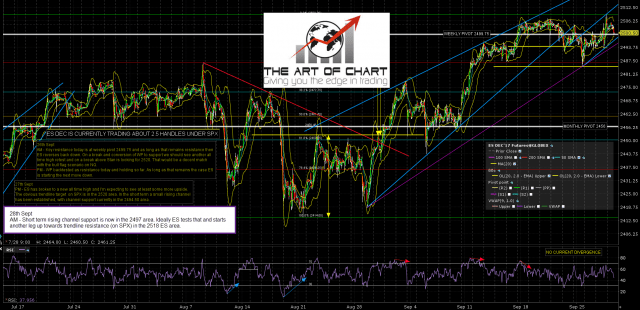
On ES a rising channel has been established from the low this week and channel support may need a test before any next leg up. That channel support is now in the 2499 area, just under the weekly pivot at 2499.75. ES Dec 60min chart:
On Monday night I noted on the chart below that NQ had established a support trendline that was a possible falling megaphone / bull flag support trendline in NQ was to reconvert the monthly pivot at 5920 to support. NQ delivered that and my main scenario as long as that remains the case is that NQ is on the way back to flag megaphone resistance, currently in the 6015 area, and on a break over that resistance would look for a retest of the all time high at 6025. NQ has backtested 5920 as support extensively today and that has held as support so far. NQ Dec 60min chart:
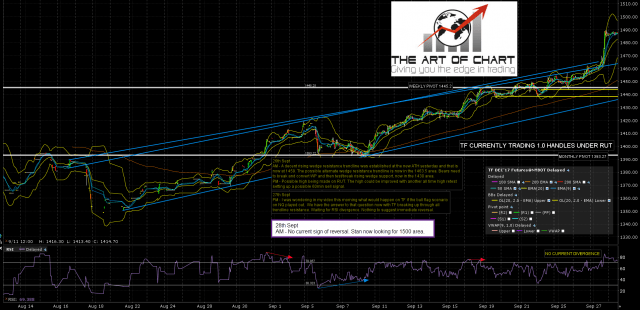
TF broke through all shorter term trendline resistance yesterday and I don’t have any obvious resistance levels to watch above. Stan is expecting a test of 1500 on this move. TF Dec 60min chart:


