
Preface to all four parts: This weekend, I’m taking my short portfolio and sharing it in its entirety with Slopers. It is broken into four parts, two for everyone and two for PLUS members. I have made a point of zooming in to the most salient part. As always, you can see any of these charts in their entirety on the wonderful SlopeCharts system.
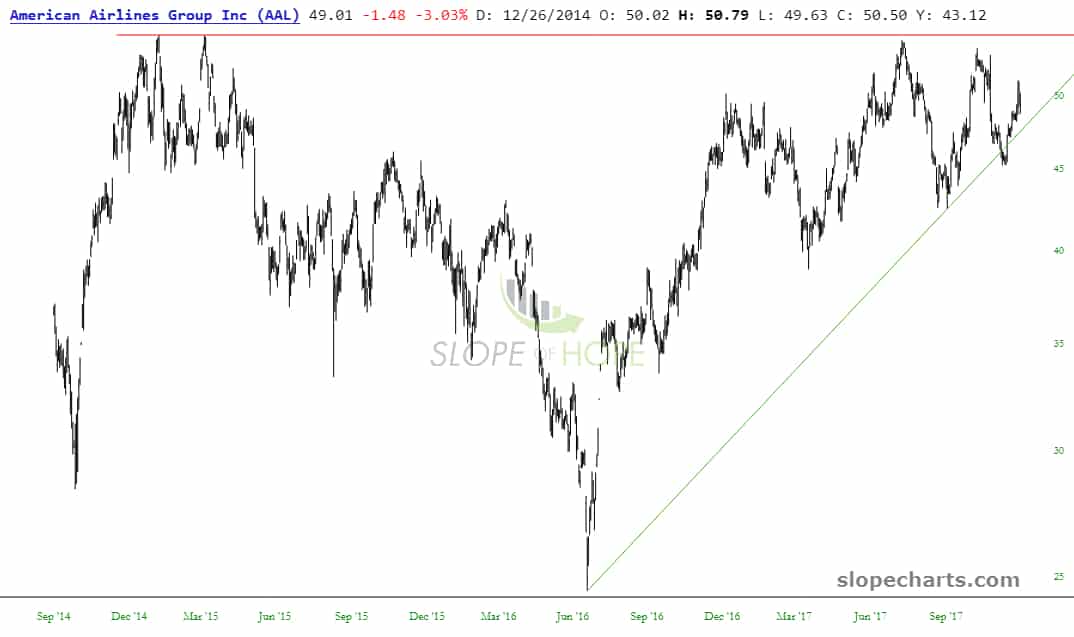
Some trendline damage already here; looking for a more definitive break:
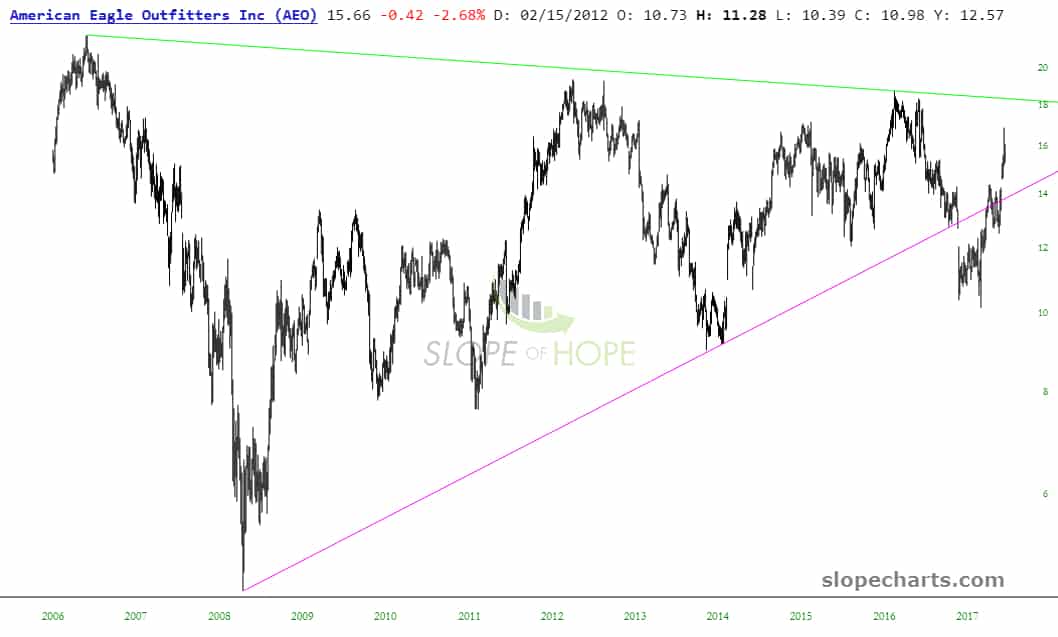
This retailer broke down hard under its trendline and rallied back into its triangle. Looking for a break below the lows set earlier this autumn:
Lower lows and lower highs for several months:
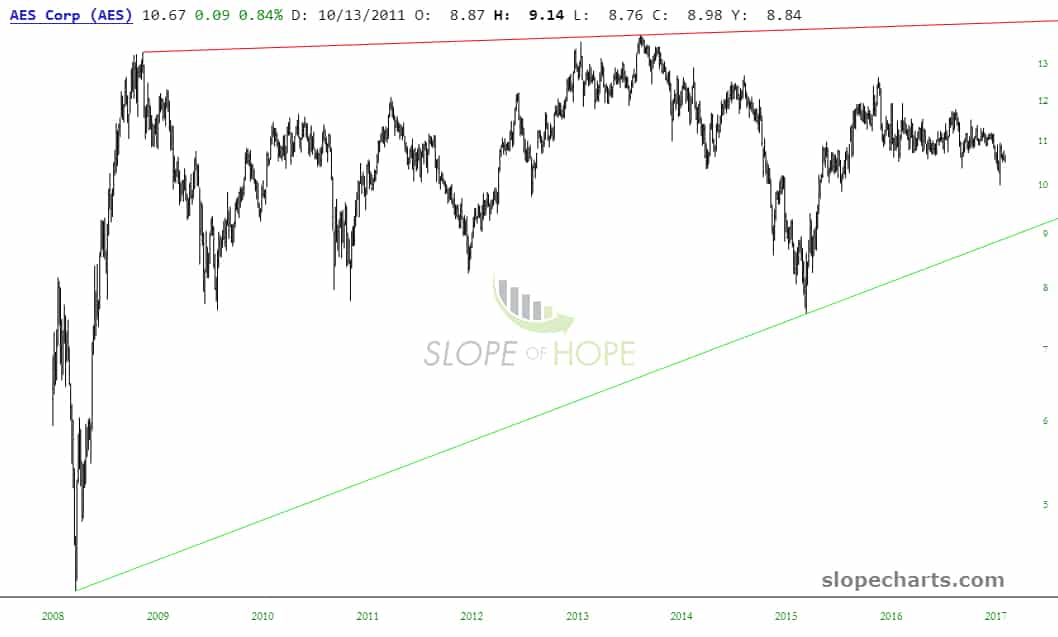
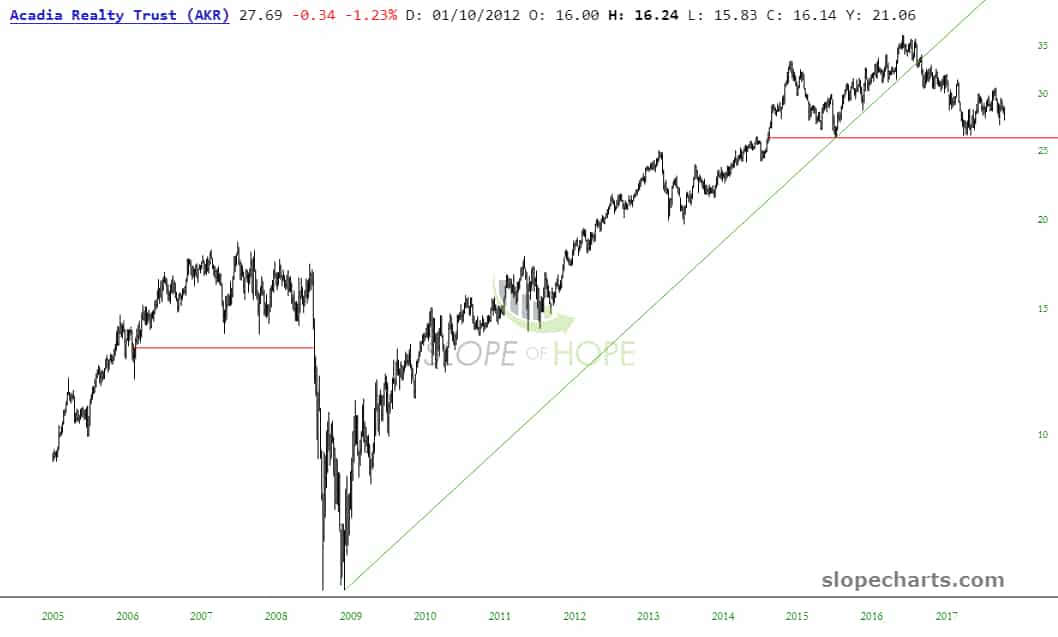
Trendline failure after triple top:
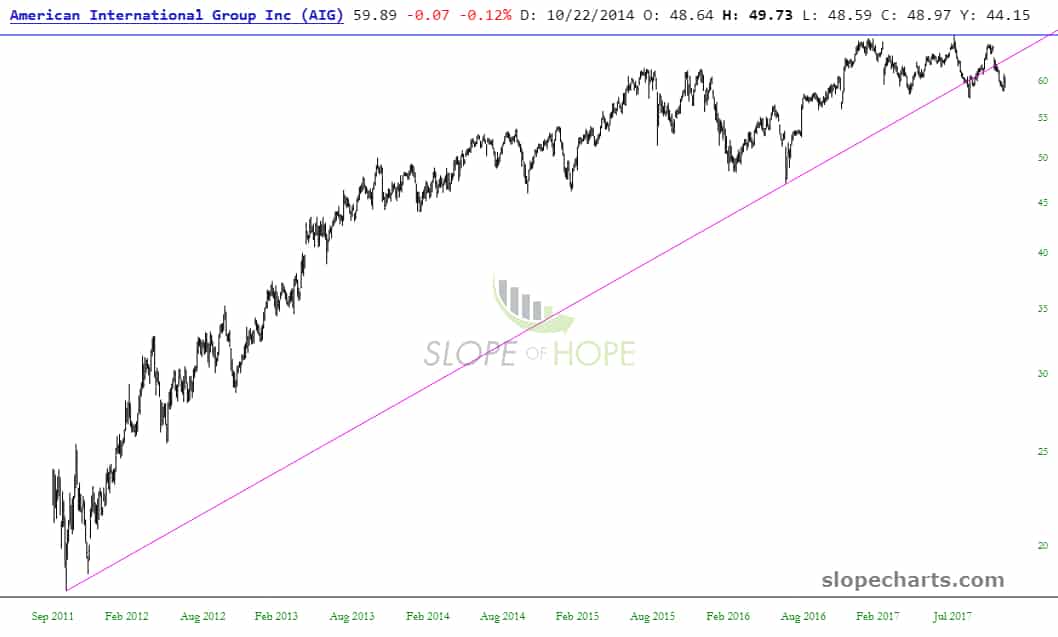
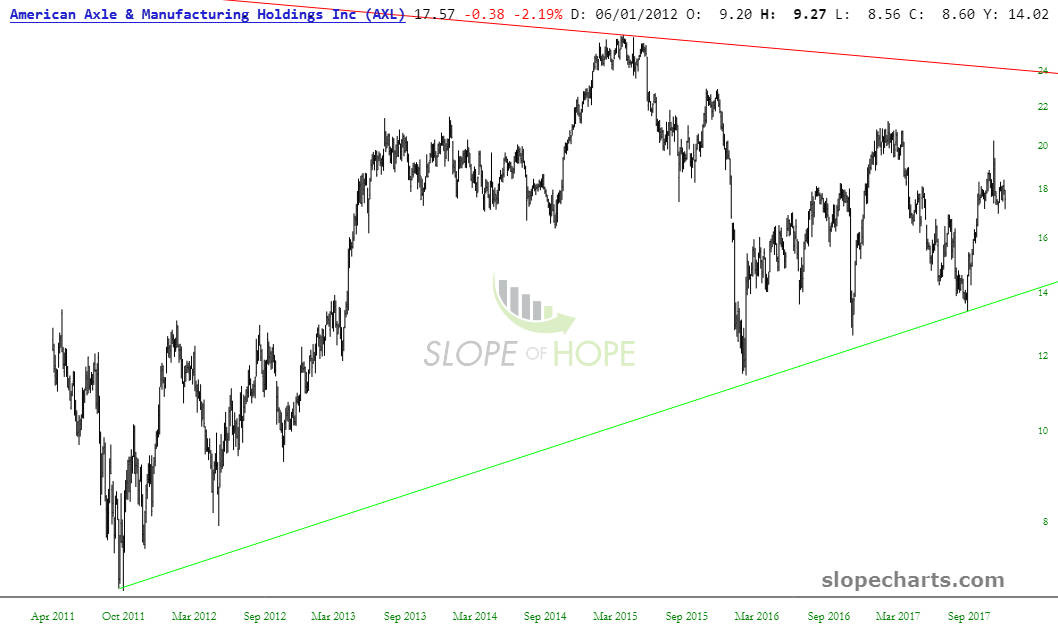
Lower lows for past several months; looking for a break of that green ascending trendline;
Analog setup, with topping about 90% complete:
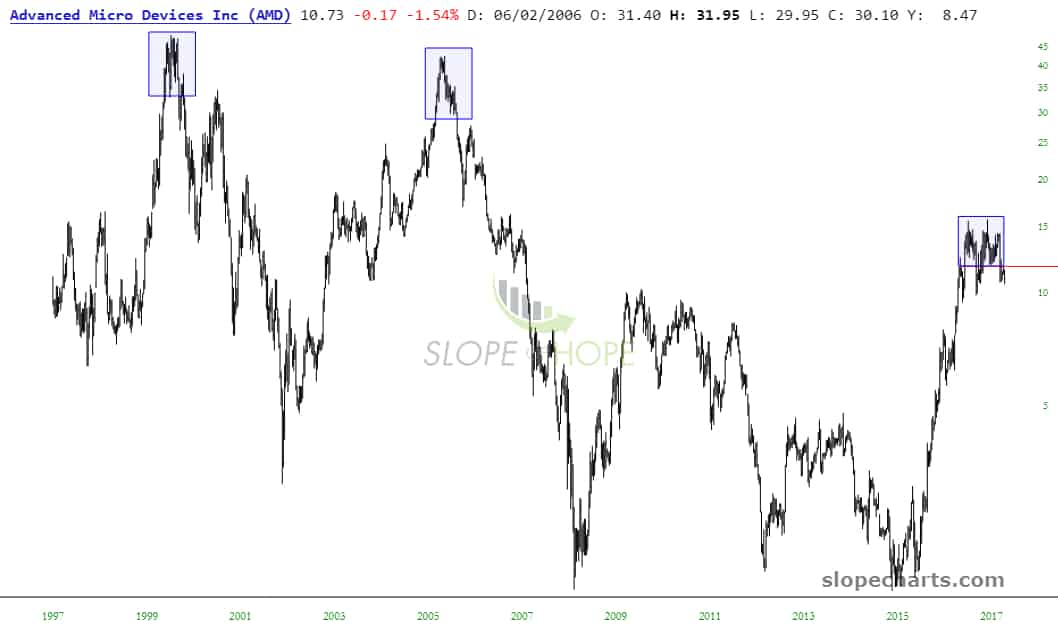
Third topping pattern (see tinted zones) in a weakening sector:
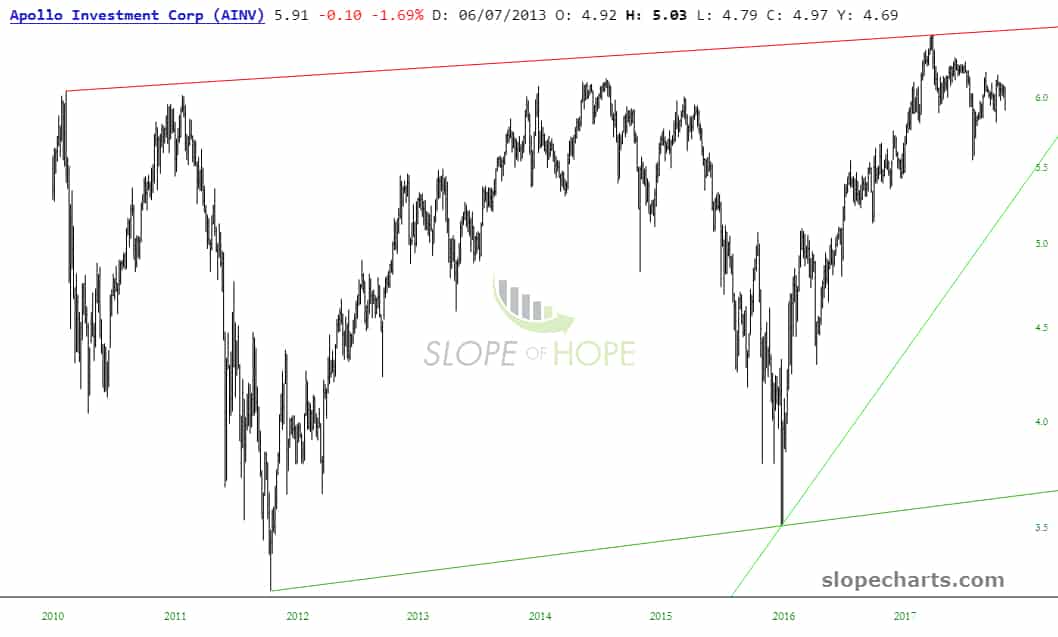
Massive overthrow above loftiest trendline:
Small topping pattern within the context of a much larger symmetric triangle:
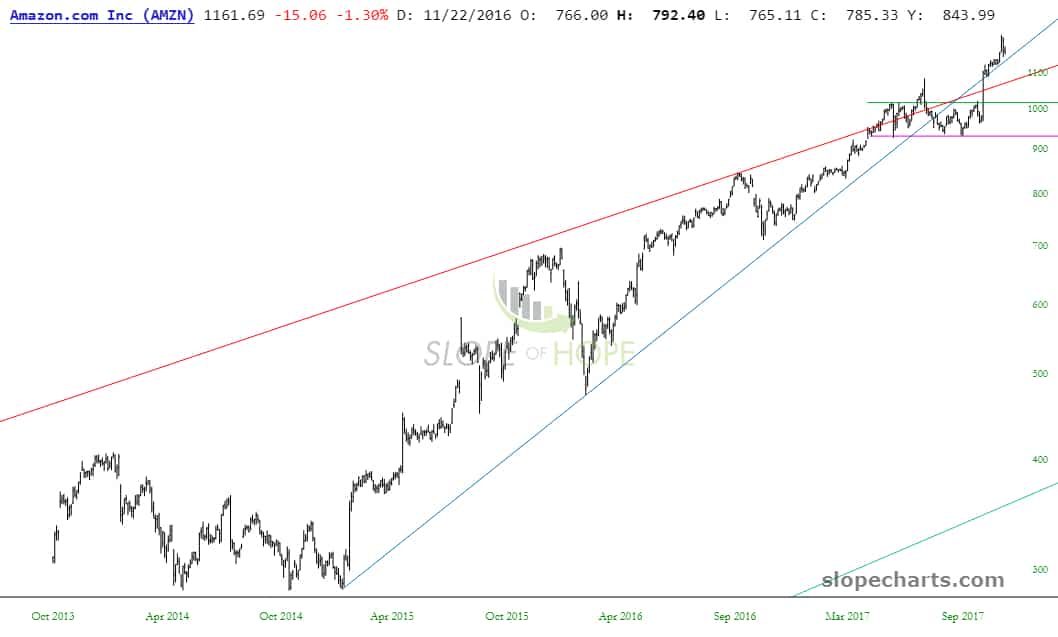
Massive rally over the past few months have brought prices to just beneath complete top:

