Slope of Hope Blog Posts

Slope initially began as a blog, so this is where most of the website’s content resides. Here we have tens of thousands of posts dating back over a decade. These are listed in reverse chronological order. Click on any category icon below to see posts tagged with that particular subject, or click on a word in the category cloud on the right side of the screen for more specific choices.

Testing SPX Middle Band Resistance

By -

I have a question for my beloved readers today and I’m hoping one of you has a good answer. I’ve teamed up with an options expert friend to run a directional options portfolio based main on futures options for the last three months, and we’ve been recording the (very impressive so far) trades and results on a spreadsheet. We’d like to move this onto a professional web based alternative that we can publish from. The setup needs to work with futures options, auto-update the options prices, and not be restricted to basic options strategies etc. Do any of you know a good way to do this? The winning reply gets three months free membership if we later launch this as a paid service, which is where this is probably heading.

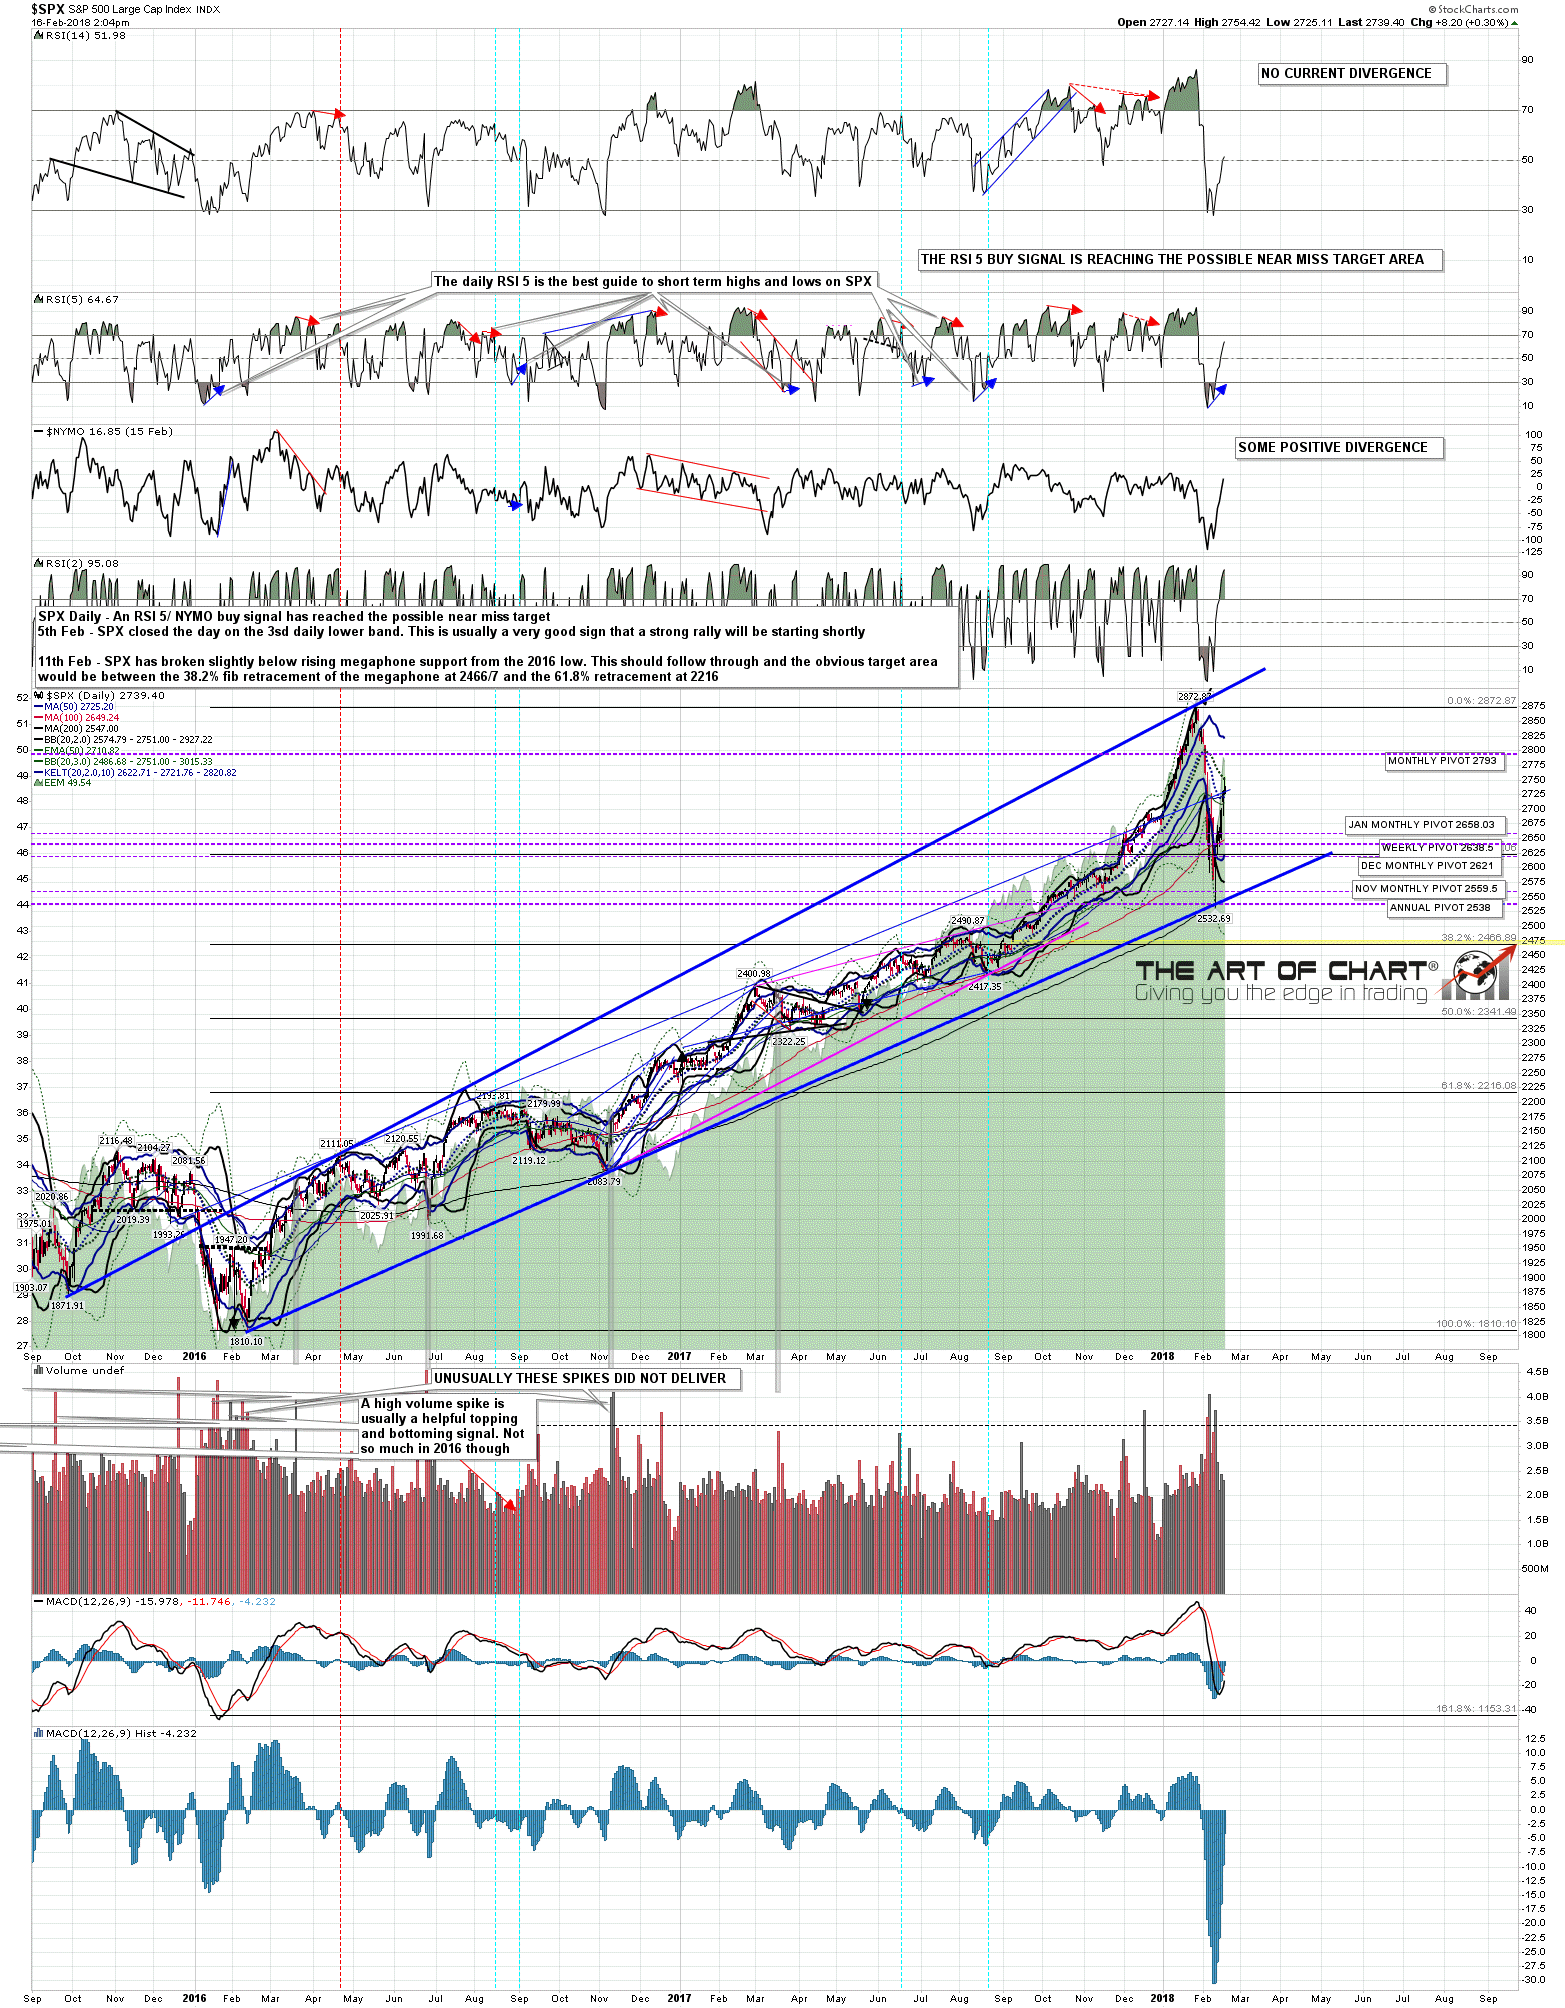
Onto the equity indices. I was mentioning yesterday that the daily middle band on SPX would be an ideal target for this rally and that has been tested on both SPX and ES this morning. Some rejection there so far and it’s possible that the rally high is in, though I’m sceptical about seeing a lot of downside in what remains of today, on an opex Friday, going into a three day weekend, so we’ll see. Intraday Video from theartofchart.net – Update on ES, NQ and TF:

Here’s the daily middle band test on SPX. Possible hourly RSI 5 sell signals are brewing on both SPX and RUT and one has fixed on NDX. Everyone have a great holiday weekend. 🙂 SPX daily chart:

180216 SPX Daily

The Age-Old Question; Inflation or Deflation?

By -

I try to have a lot of different ways of looking at the macro backdrop because if enough of them imply the same thing then a strong probabilities-based thesis can be made.

For instance, currently we are looking at long-term Treasury yields hit (10yr) or get very close to (30yr) upside targets. You know my stance there; I think risk is pretty high for a downward reaction in yields before too long. I’ve backed that view with portfolio balancing positions in 3-7yr and 7-10yr bonds. But even if a reaction comes about (and especially if it doesn’t), the big question is whether or not we are going into territory that has been uncharted for decades.

So are we going to eventually break the Continuum’s limiter? Here is the 30yr yield, almost to a target that few saw coming several months ago, outside of this website when we ID’d the downward consolidation as a bullish flag and used daily charts to gauge bullish patterns in the 10yr & 30yr. (more…)

Too Close For Comfort

By -

In the depths of the selloff last week, I decided the counter-trend bounce would get to around 2740 on the ES and “the low 25000s” on the Dow. Well, both of those have been achieved. In spite of the counter-trend rally matching my targets, it still makes me very uneasy. It seemed that earlier today (Thursday), the selloff was resuming, but that weakness vanished, and we are at a place now where, frankly, one more strong day would cause some real harm to my confidence.

dow30

There isn’t any big news coming out on Friday, but with five solid days of powerful upthrust, the momentum is definitely on the side of the bulls. If it keeps up, I’ll just dial back on the shorts. I hope not, though; I’ve got plenty of great setups I’d love to put into motion.