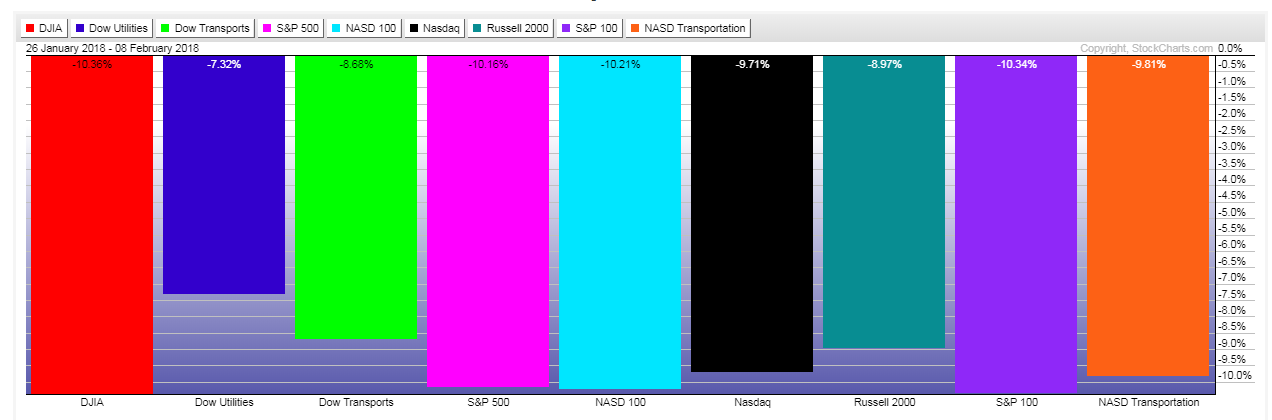
After another volatile day of trading on Thursday, all of the nine US Major Indices closed down hard and four are officially now in 10% correction territory (with the others closely behind), as shown on the following graph, which shows their losses since prices peaked in January.
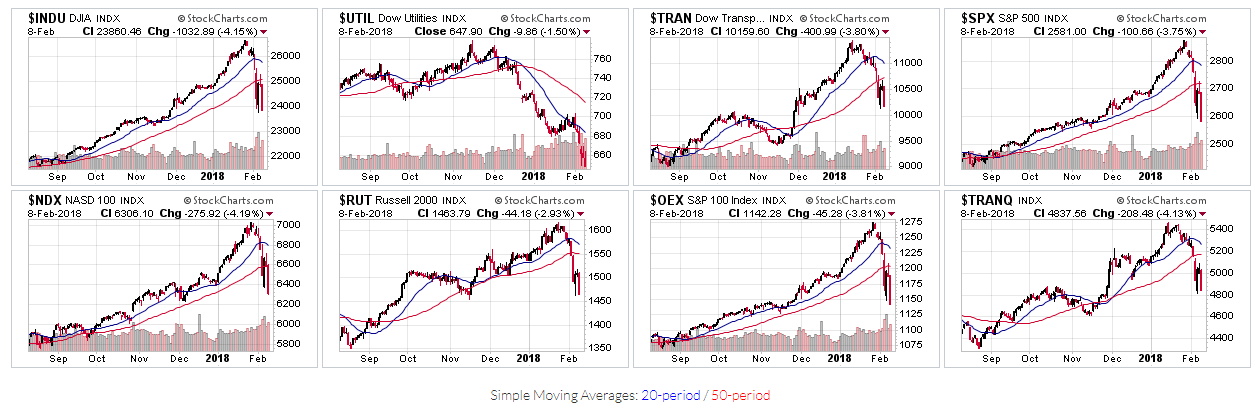
Here’s a look at their 6-month daily chart. All of them are below their 50-day moving average.
The following monthly chart of the SPX:VIX ratio shows that the trading range of February’s candle is the largest, in history, after only 6 trading days. Price has now entered into the “uncommitted zone” and is hovering just above the “fragile zone.” Historically, price action on the SPX consists of wild, aimless/trendless and very volatile swings when this ratio remains below 150.

World Markets, in general had a bad day on Thursday, as can be seen from the graphics below.
 |
| Source: CNBC.com |
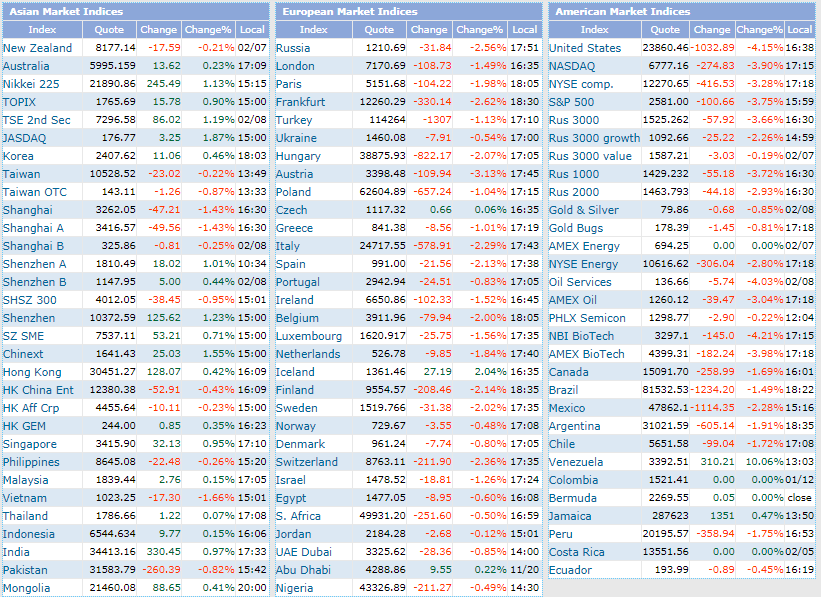 |
| Source: Indexq.org |
Additional graphics show today’s activity for US Major Indices, Sectors and Futures Markets…
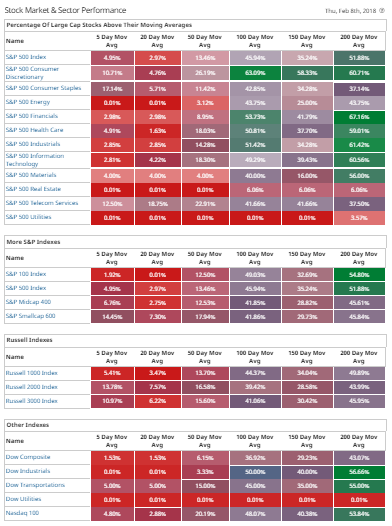 |
| Source: Barchart.com |
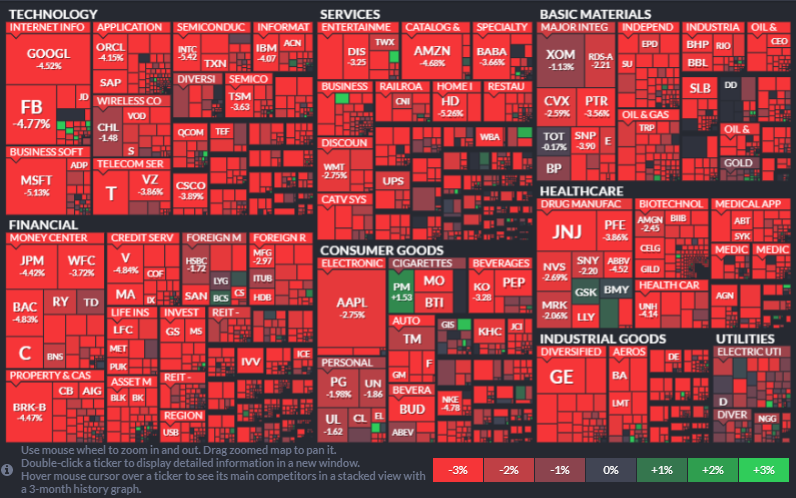 |
| Source: Finfiz.com |
 |
| Source: Barchart.com |
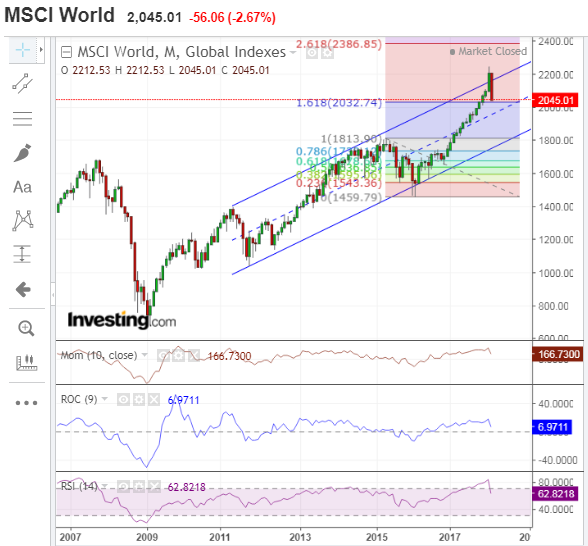
Finally, the MSCI World Index has dropped to its external Fibonacci retracement level of 1.618%, as shown on the monthly chart below. It has also fallen back into a long-term uptrending channel, after briefly popping above. A drop and hold below that level (2032.74) could send all world markets into a tailspin.
Keep an eye on the 60 level on the SPX:VIX ratio, as a drop and hold below could spark panic selling in the SPX. In any event, watch for more volatile swings as long as it holds below 150, and, especially, 100.