What is likely happening here is that SPX is doing an ABC retracement while forming a bull flag to go higher. Wave A was the first leg down and wave B was likely the rally into the lower high that we have seen so far. What we should see next is the C leg down below the wave A low, possibly extending as low as the daily middle band in the 2679 area, before the next leg up on SPX.
However last year that’s not the way this worked. The uptrend was so strong that every time the moment came for a second leg down, SPX broke up instead. That was the 2017 playbook and I’m not expecting to see that here, but it’s on my mind as a possibility.
Full Intraday Video from theartofchart.net – Update on ES, NQ and TF, and CL, NG, GC, HG, ZB, KC, SB, CC, ZW, DX, EURUSD, GBPUSD, AUDUSD, NZDUSD, USDJPY, USDCAD:
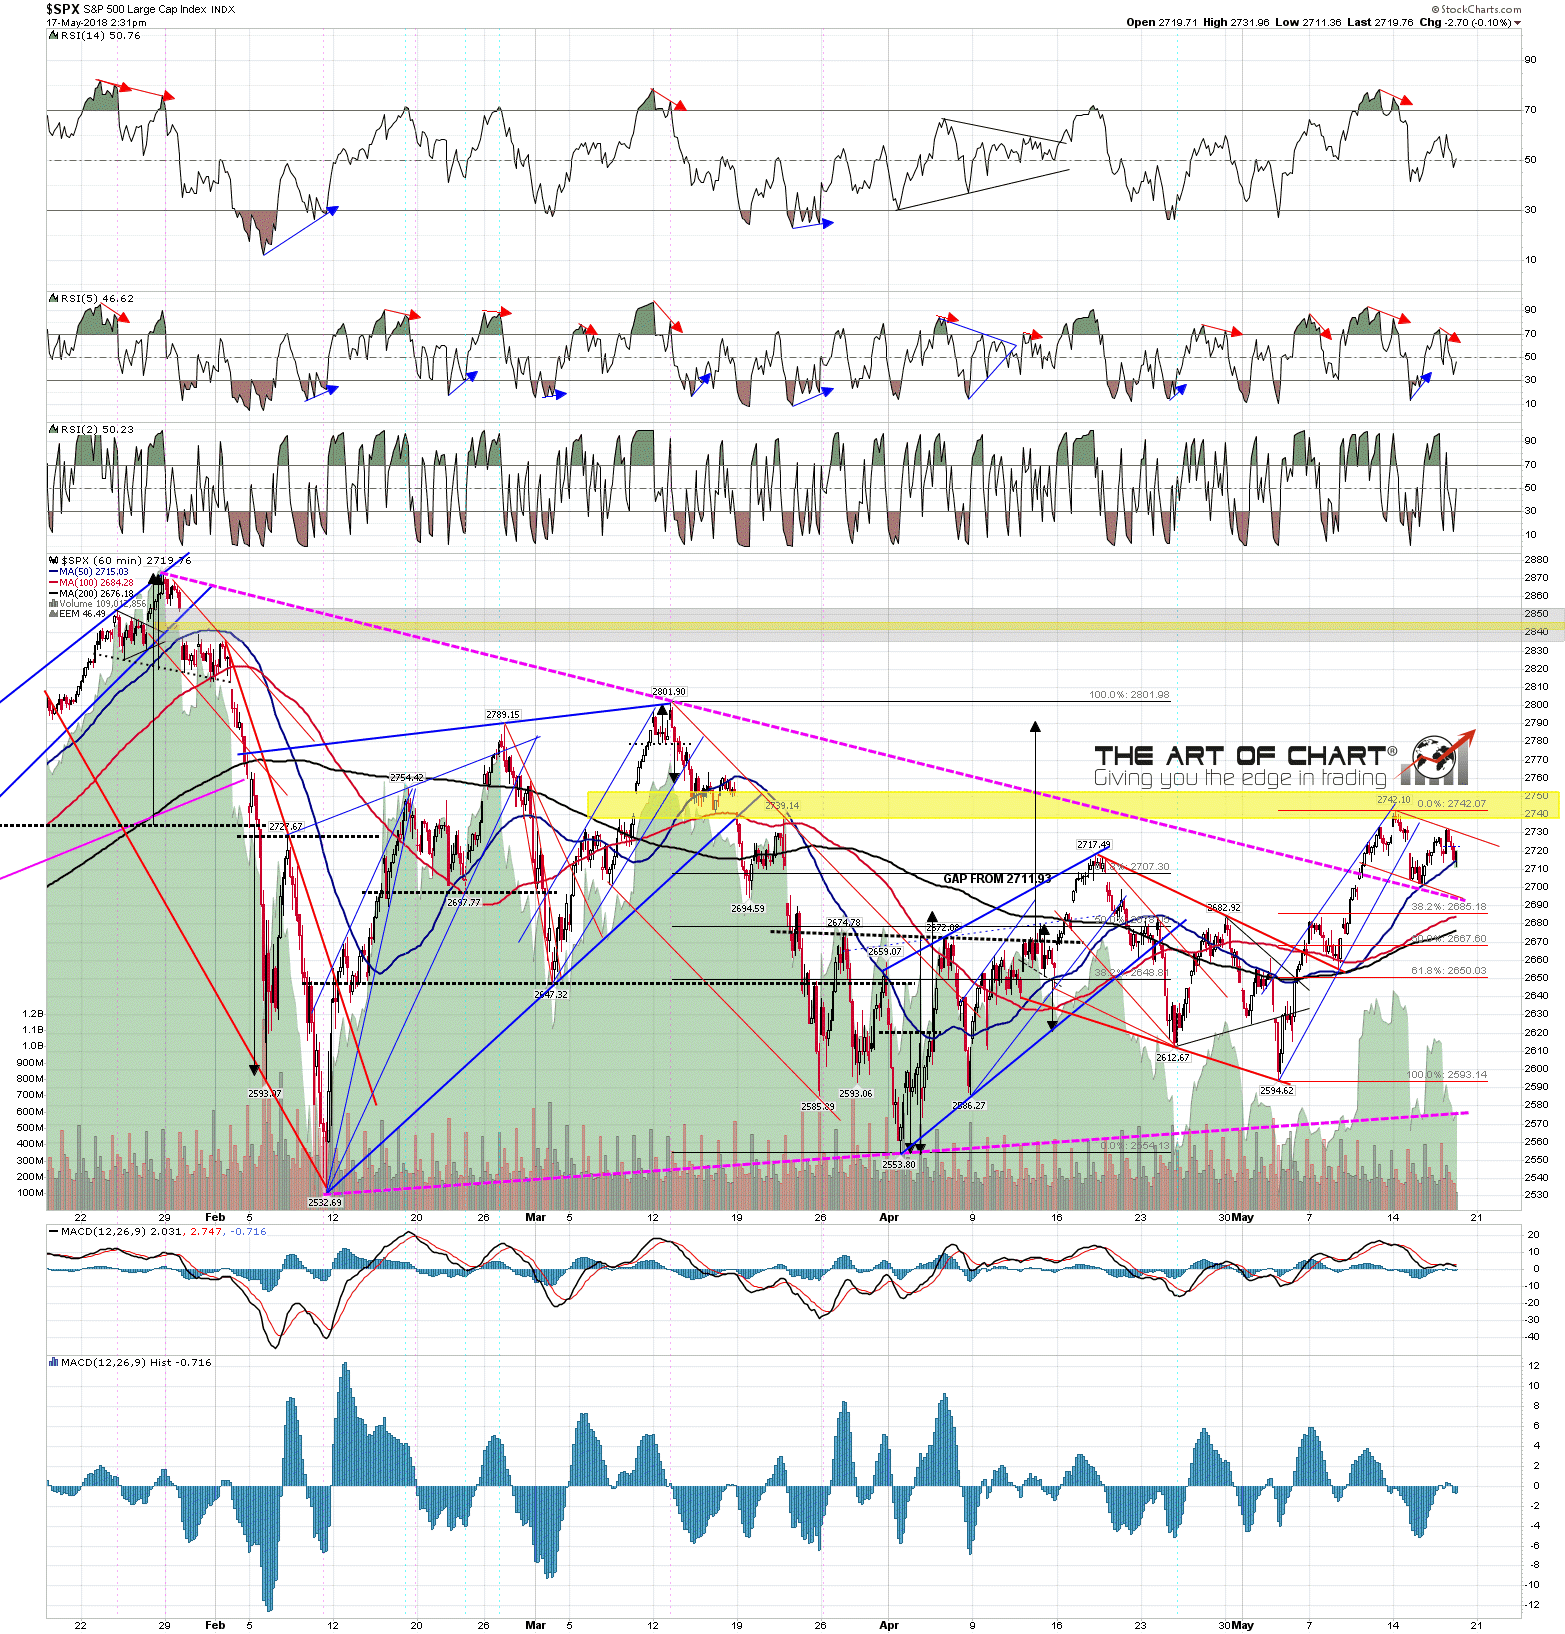
I’ve drawn in a possible flag channel, though obviously flags can also be wedges, megaphones or triangles. If this was to be a channel then SPX would likely find support at the retest of broken triangle resistance in the 2692 area. SPX 60min chart: