
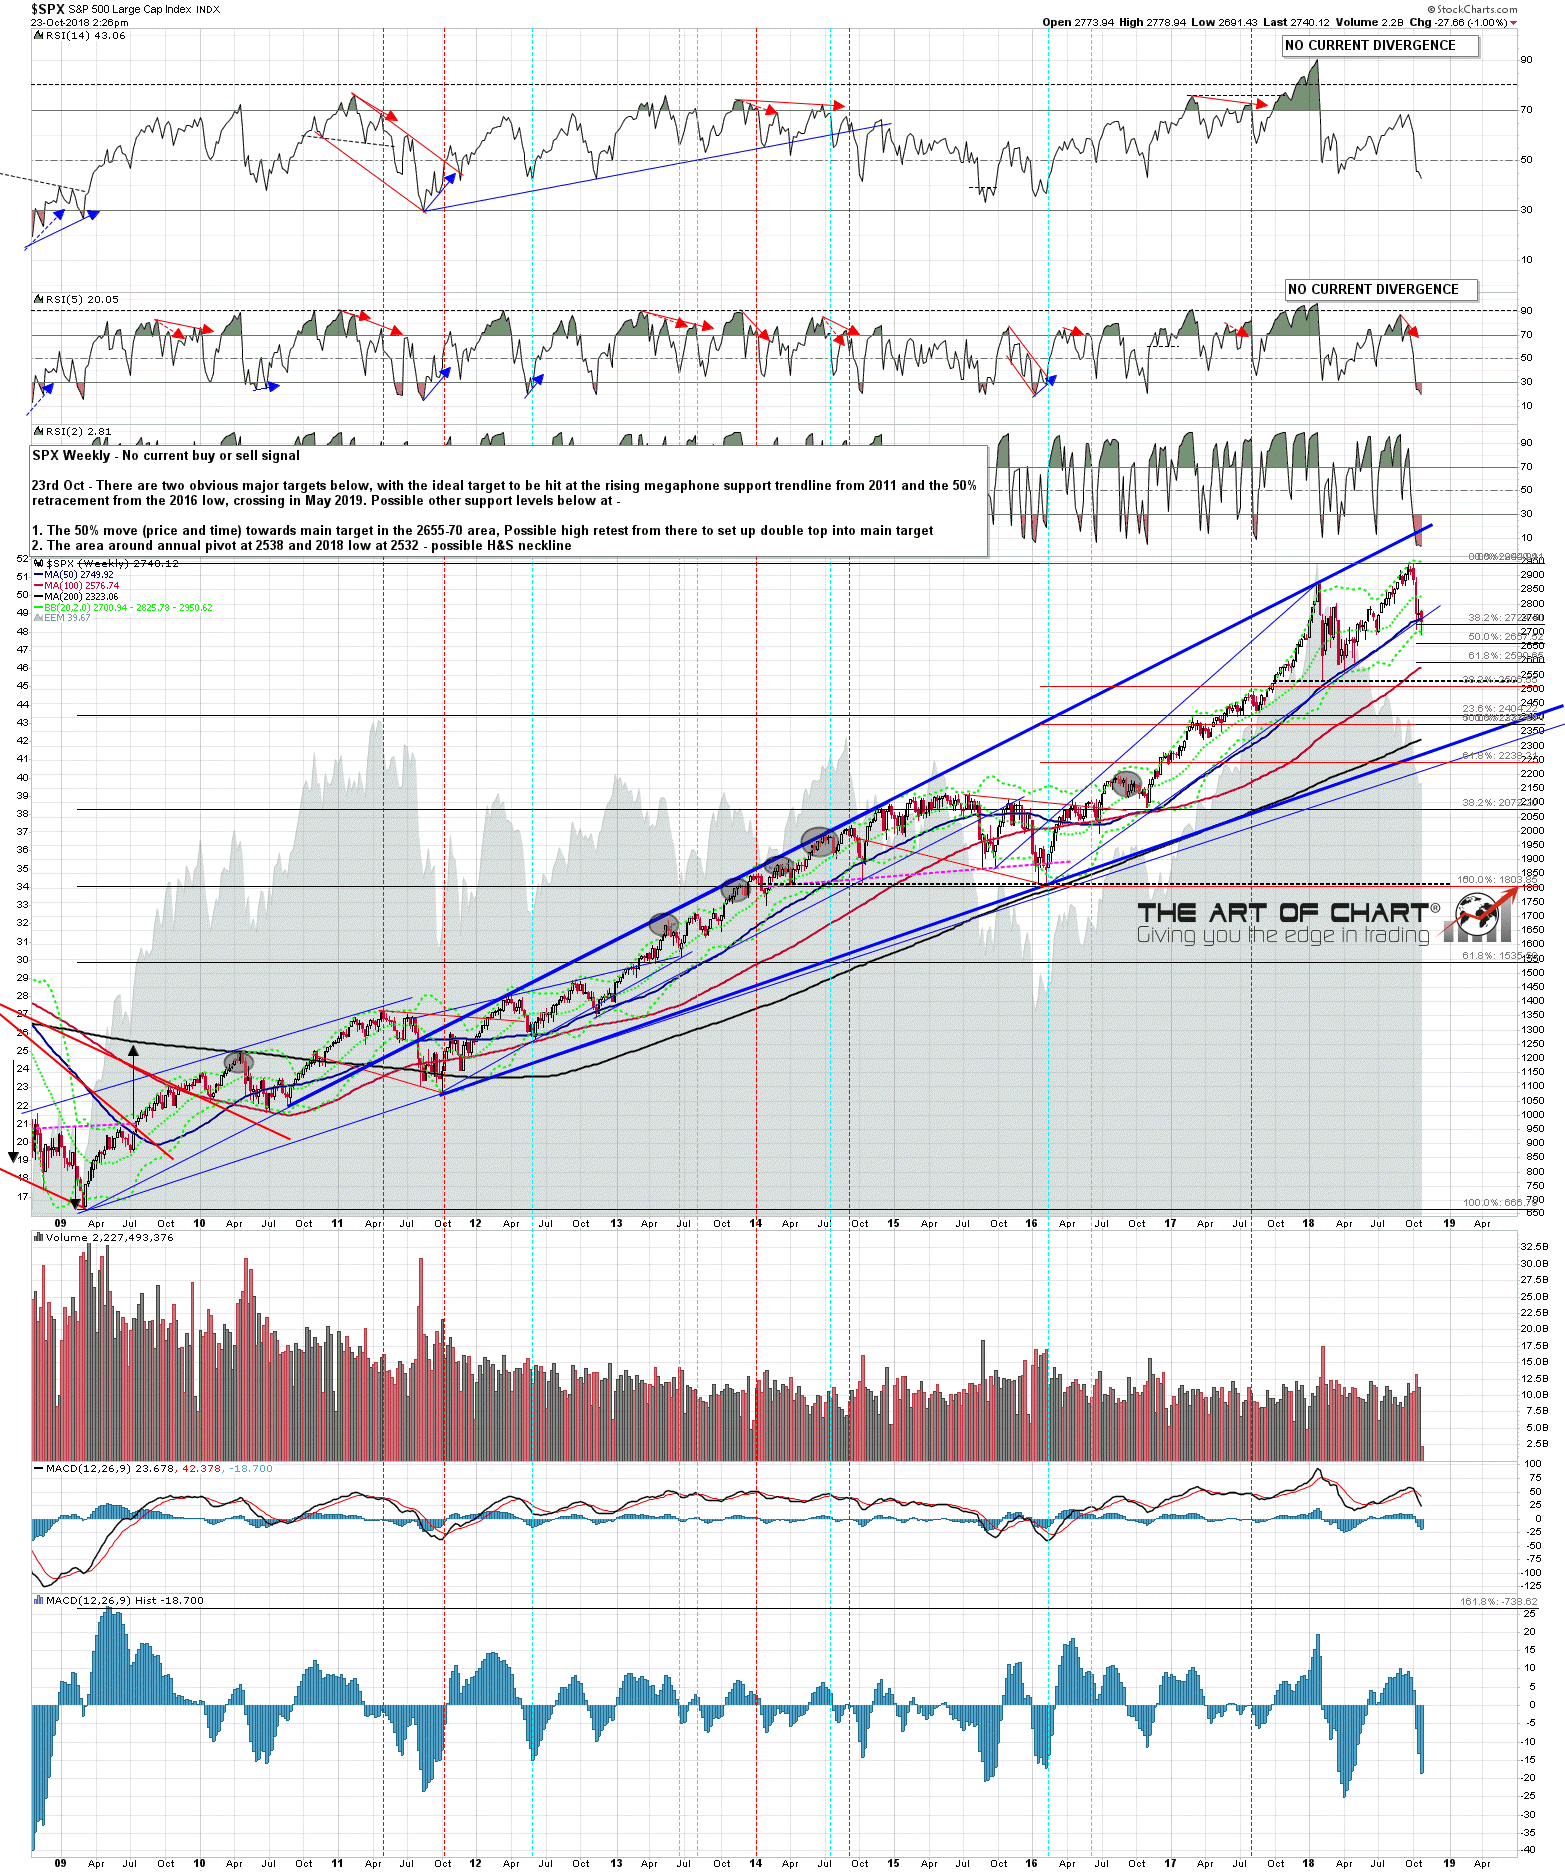
SPX retested the retracement low this morning, so the Three Day Rule target has been reached. This is a return to form after the first fail on this stat since the start of 2007 in April/May 2018. Still the strongest stat I follow. So what now?
From a cycles perspective there is a cycle high window in January, then a big cycle low in May 2019 at which we are thinking we should see the main low for this move. The ideal target for that low then would be a test of rising megaphone support from the 2011 low to be hit in the 2370 area, which would also be at the 50% retracement of the move up from the 2016 low. There are two very decent looking options for reversal on the way.
The first is in the the 2655-70 area, from where we could see a reversal to retest the high, to set up a double top looking for the main target area.
The other is a retest of the annual pivot and 2018 low area 2532-38, which is the obvious full retracement of the move from there and a possible large H&S neckline. If that H&S was to to form, with the right shoulder high ideally in the 2870 area in January, then on a break down the H&S target would be in the 2140 area, with a likely inflection point at rising support from the 2011 low where that would either hold and end the retracement there, or break to open up that full H&S target.
SPX weekly chart:
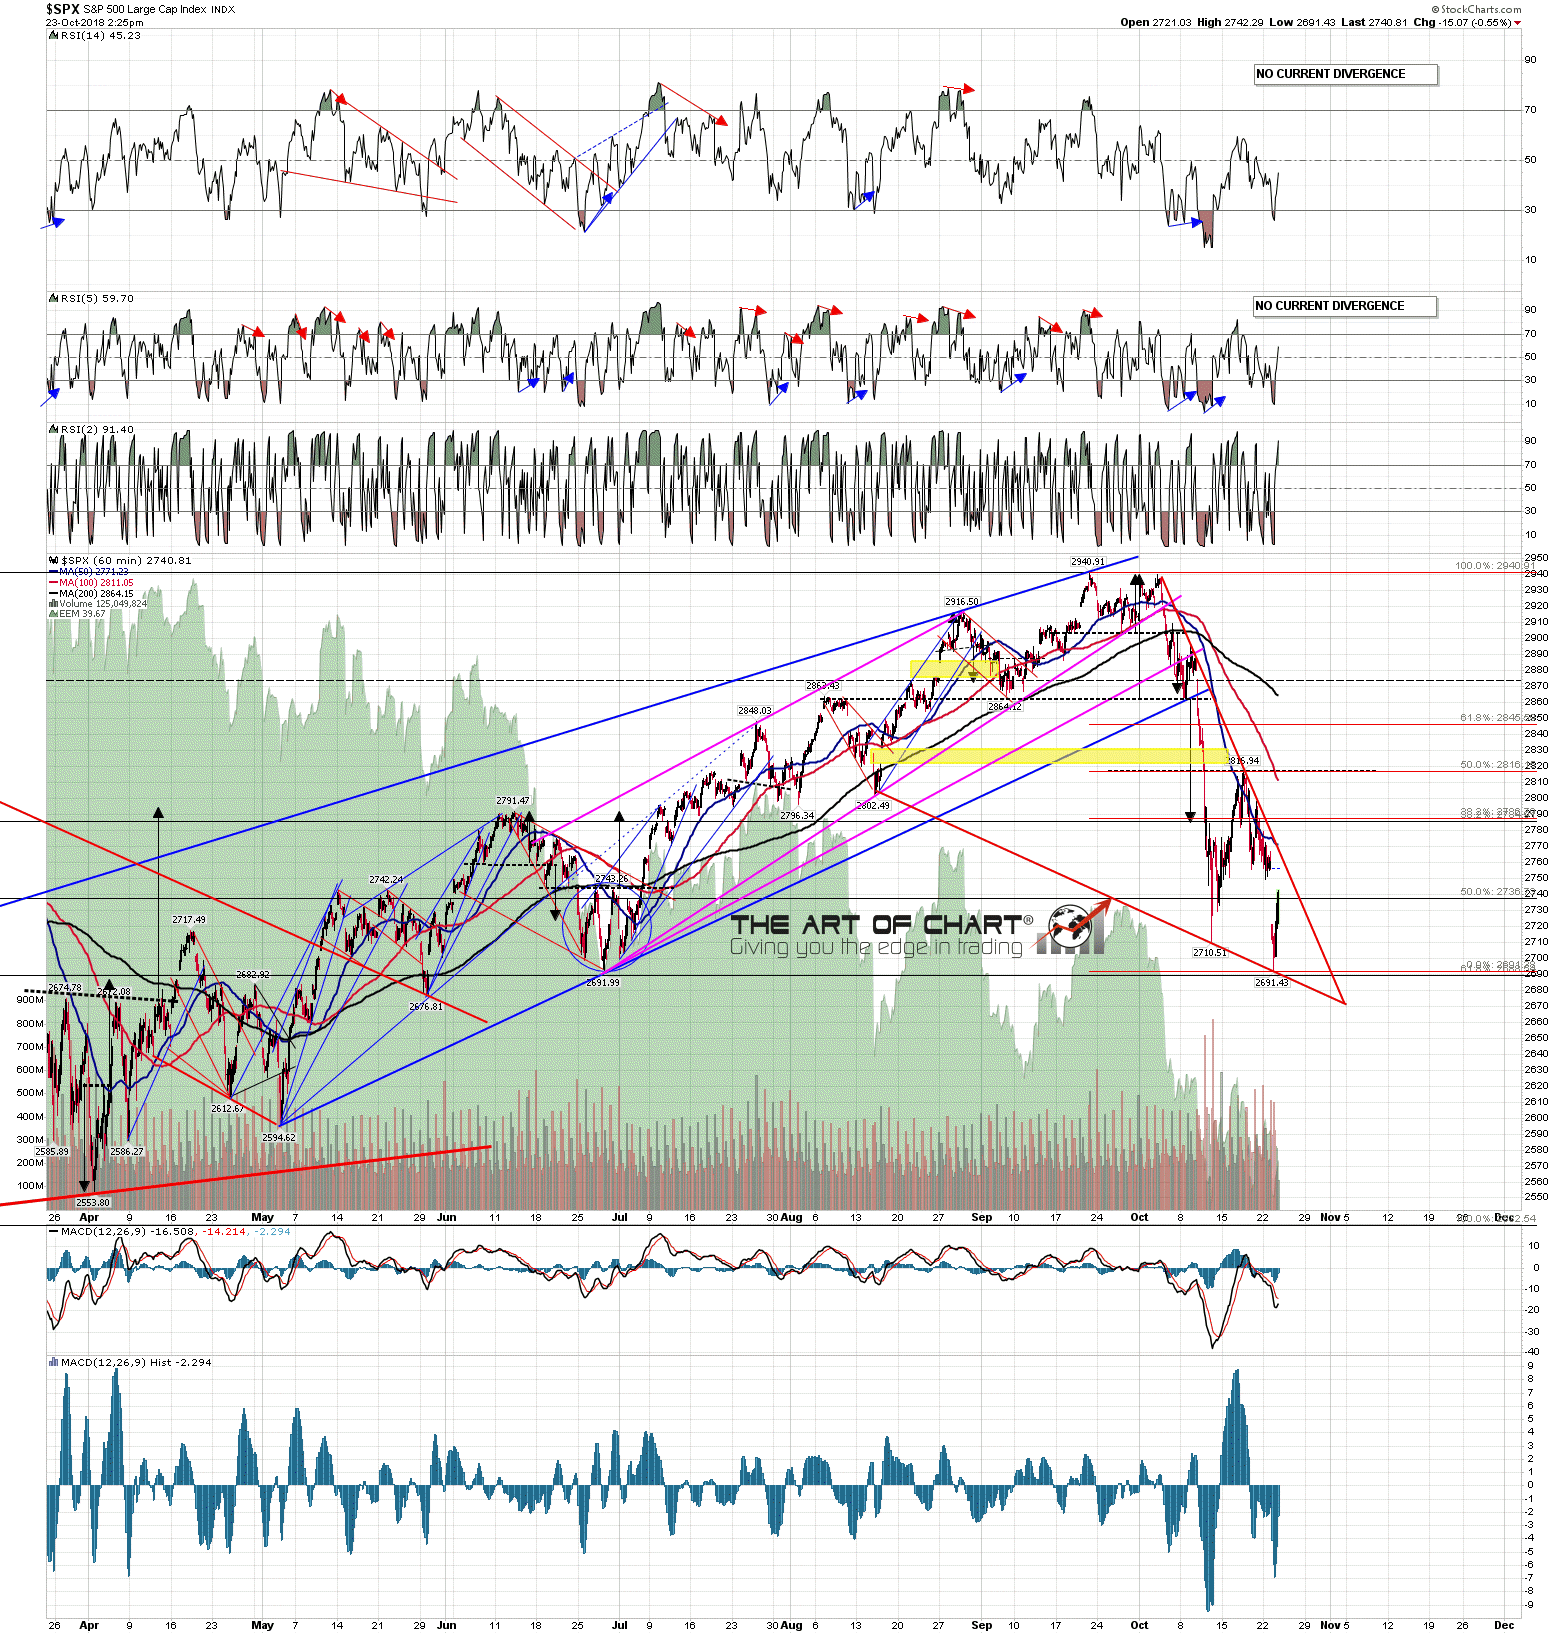
In the short term we are seeing a rally from this morning’s low that should fail into at least a retest of that low. That fail should ideally be at or below declining resistance from the high, currently in the 2765-70 area. SPX 60min chart:
Stan and I are doing two free public webinars this week. The first is the Paragon Options webinar after the RTH close tomorrow at 5pm EST, delayed from 11th October, and on Thursday after the close we are doing our monthly webinar on the FAANG (+TSLA) and key sector ETFs. If you’d like to register either or both you can do that on our October Free Webinars page.
