Further to last Wednesday’s post, here’s where the U.S. Major Indices stood after each close on Thursday and Friday, respectively.
Thursday’s Close:
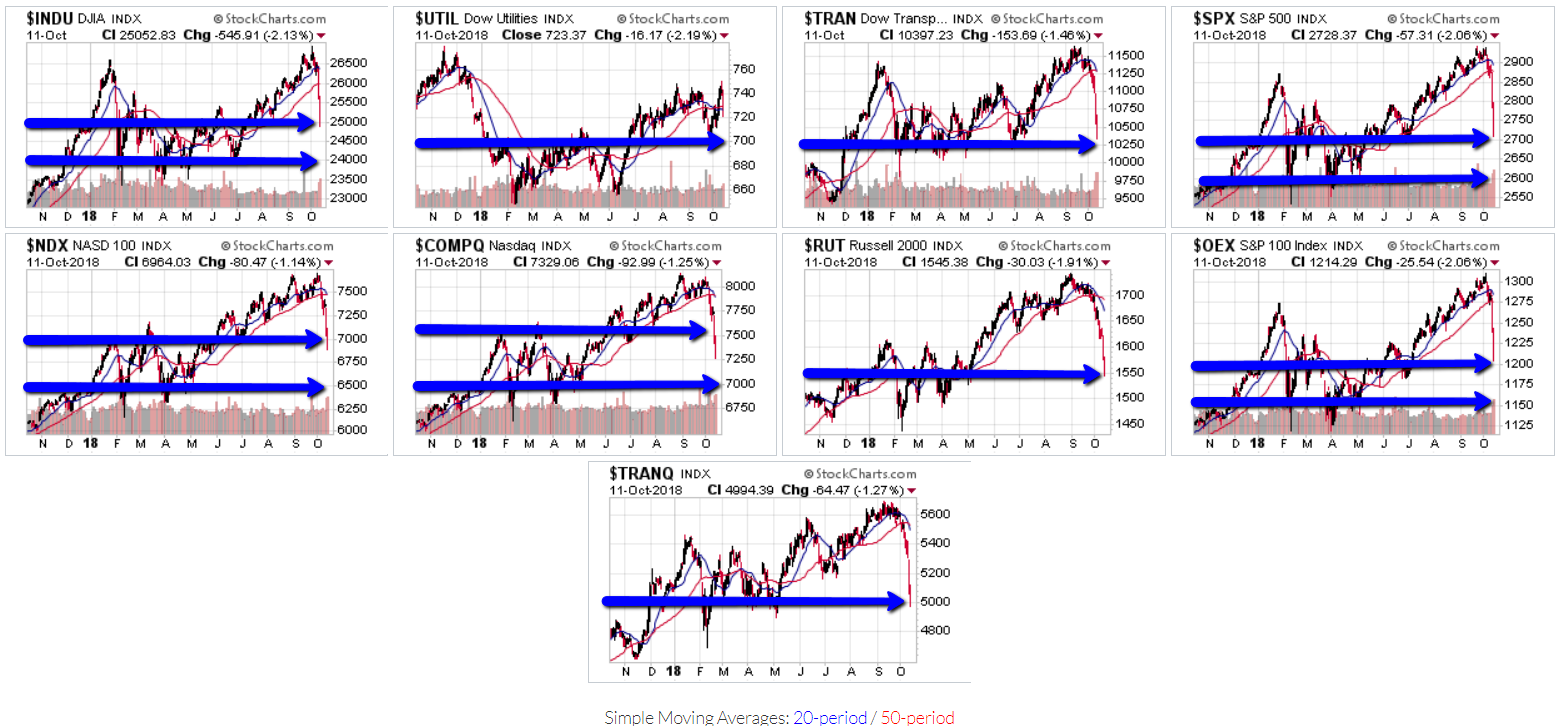
Wednesday’s sell-off continued on Thursday, with the nine Major Indices closing at or near a lower near-term support level (or below, as was the case with the NDX and COMPQ), as shown on the following daily charts.
The following percentages gained/lost graph shows the amounts that these indices had lost to date from their highs of this year.
The Russell 2000 and Nasdaq Transportation Indices were now in correction territory, while the Nasdaq Composite, Nasdaq 100 and Dow Transports Indices were close to that 10% threshold.

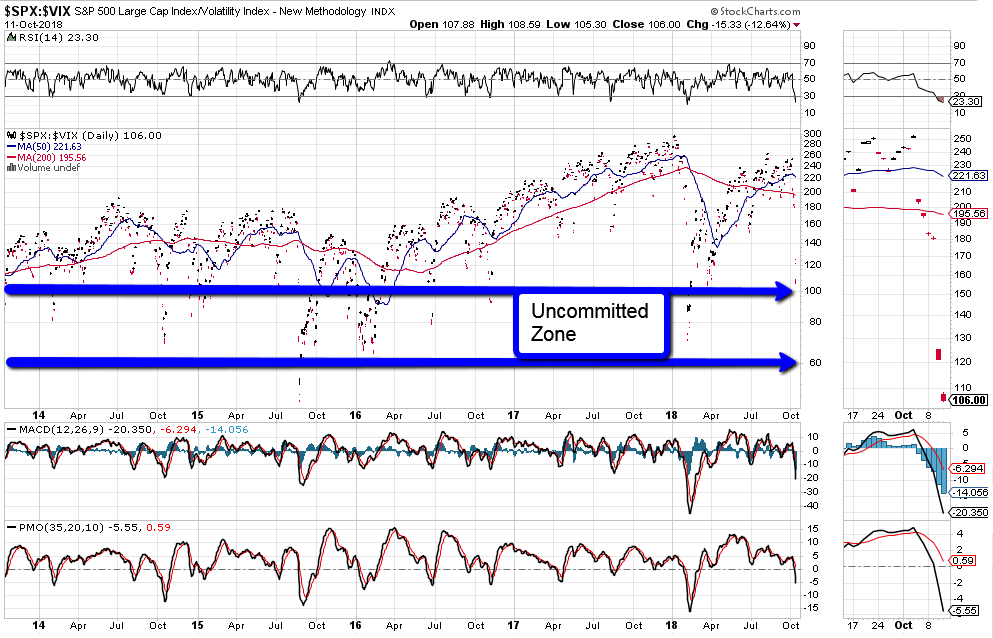
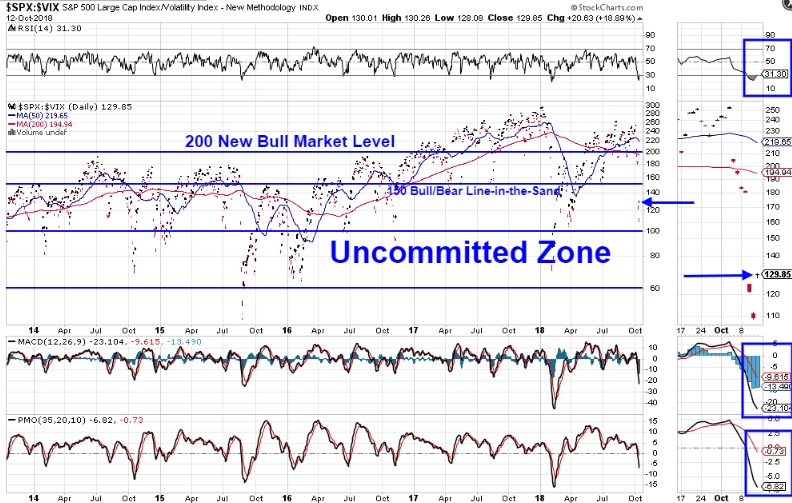
Price on the SPX:VIX ratio had fallen to just above a level that I’ve long referred to as the Uncommitted Zone (between 100 and 60), as shown on the daily ratio chart below.
A drop and hold below 100 would ensure further weakness ahead in the SPX, while a drop and hold below 60 could produce a catastrophic drop in equities.
Either way, as long as price on this ratio remains below 150, we’ll see wild, large intraday swings in both directions on the SPX.
This volatility and weakness will likely not die down until price breaks and holds above 200.
Friday’s Close:
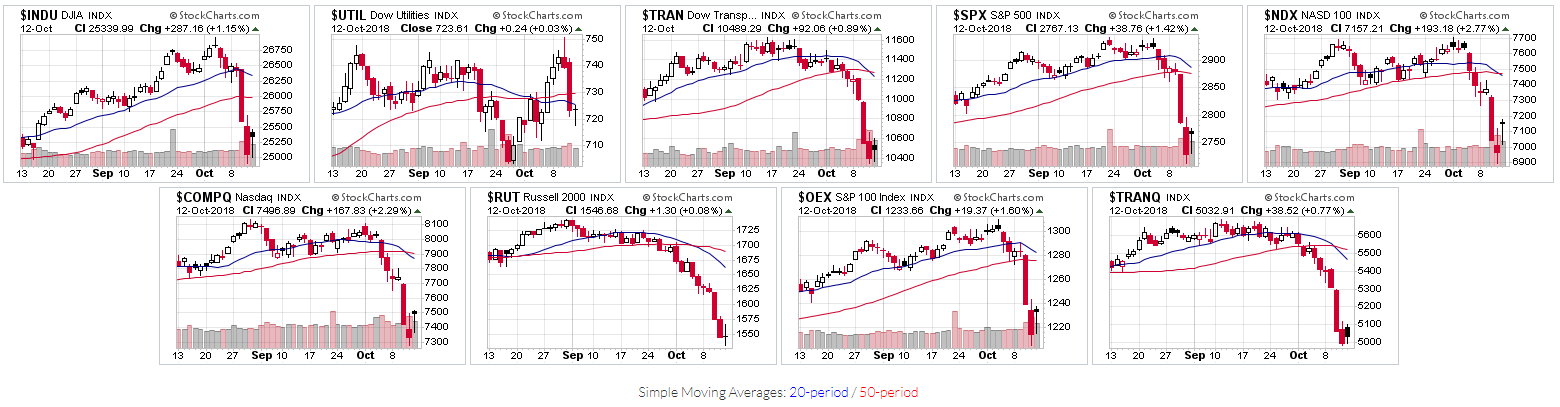
The week’s sell-off stalled on Friday, as we witnessed wild, large intraday swings in both directions before prices settled, either a bit higher, or slightly unchanged (Russell 2000, Utilities, and Nasdaq Transportation Indices), as shown on the following 2-month daily charts of the nine Major Indices.
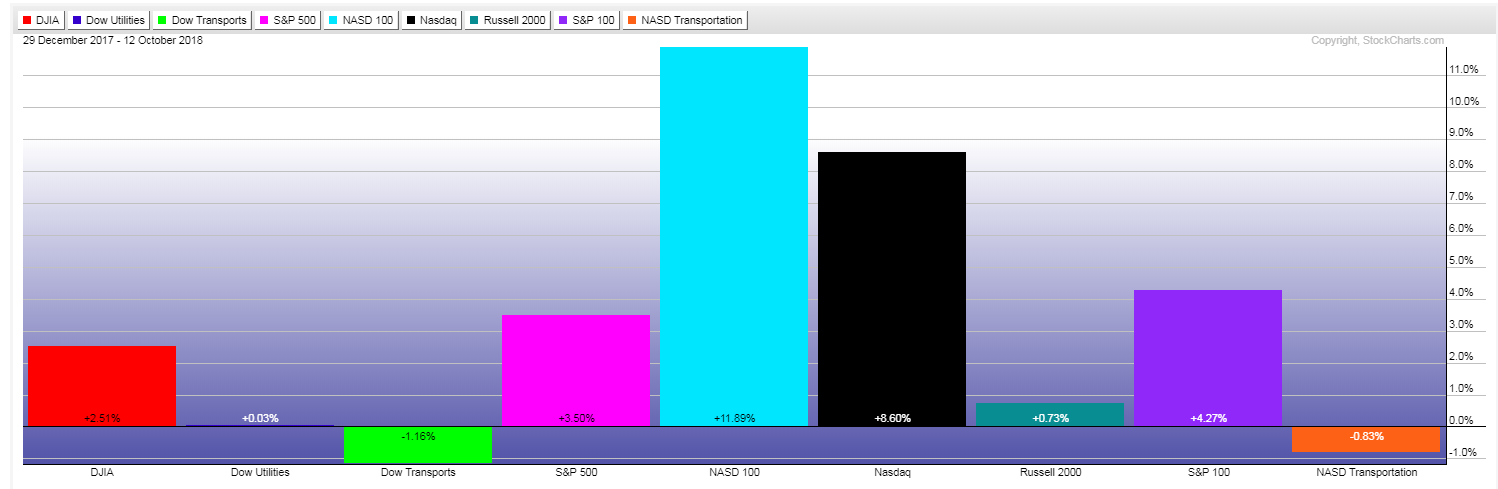
The following graph shows the percentages that these indices have gained/lost Year-to-date.
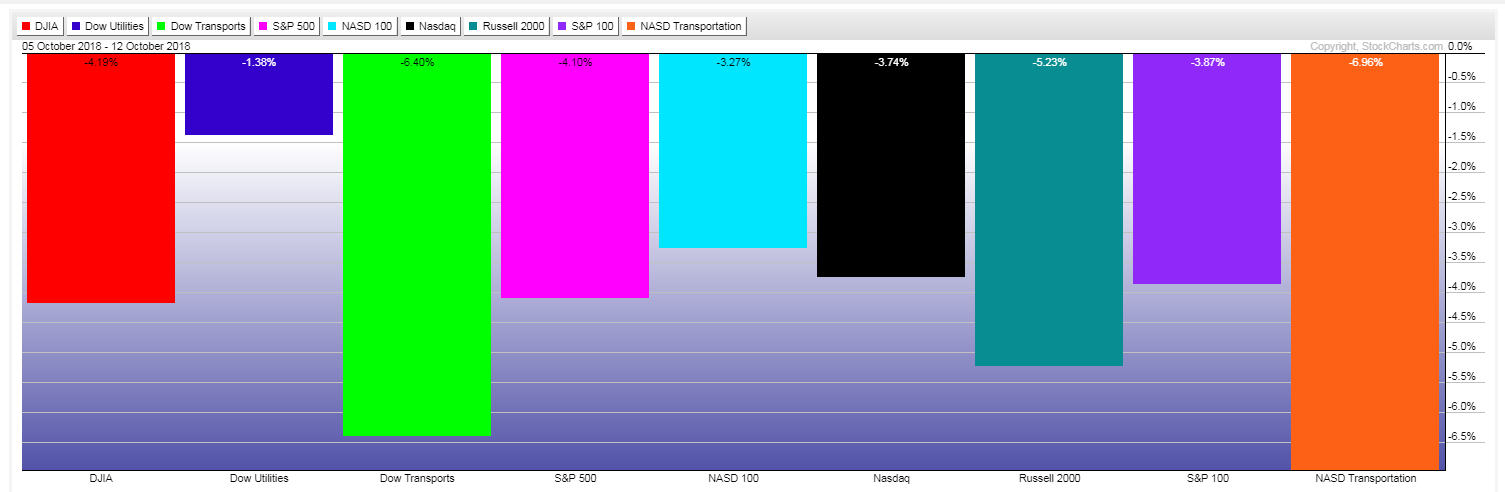
The following graph shows the percentages that these indices lost during this past week.
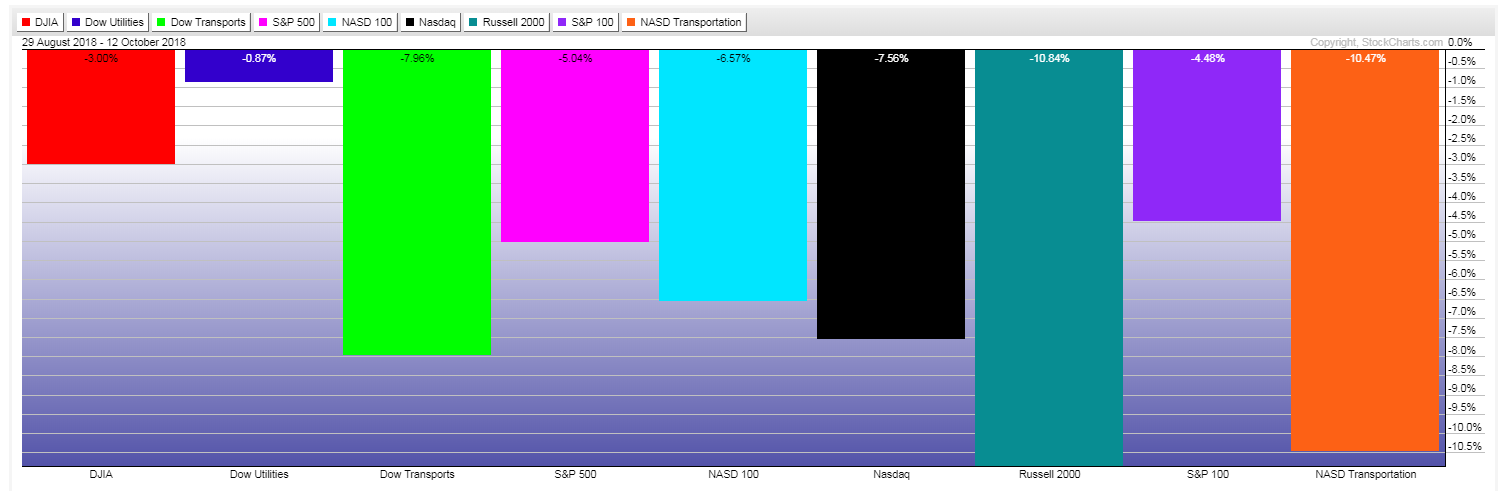
The following percentages gained/lost graph shows the amounts that these indices have lost to date from their highs of this year (August 29).
The Russell 2000 and Nasdaq Transportation Indices remain in correction territory (10%+), so far, this year.
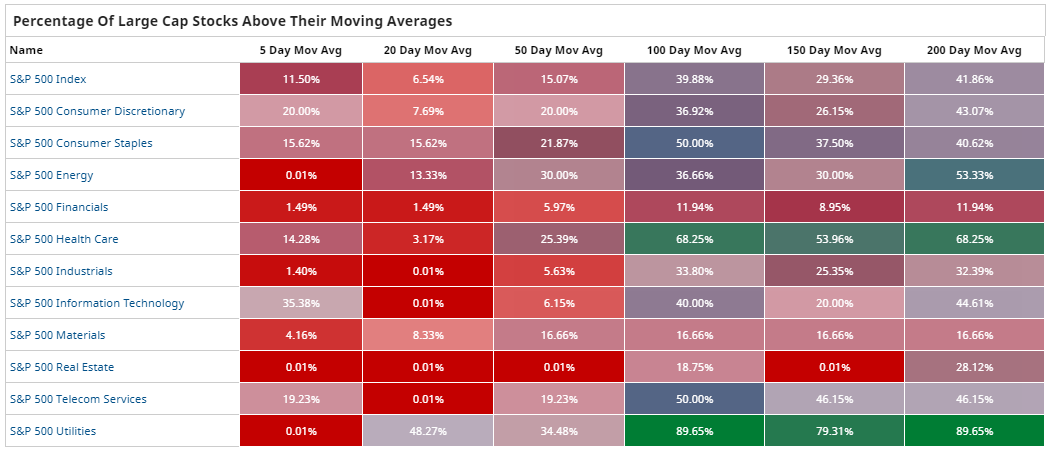
The following tables show the percentages of Major Markets and Sectors that are trading above a variety of moving averages.
A quick glance at those still above their 200-day MA shows that the S&P Energy, Health Care & Utilities Sectors, Dow 30, Dow Utilities and Dow Composite Indices remain the strongest, so far, this year.
A further breakdown in the Dow Indices, in particular, may spell further trouble for U.S. equities, in general.

The following daily ratio chart of the SPX:VIX ratio shows that price bounced a bit on Friday and remains above the 100-60 Uncommitted Zone…but is still below the 150 Bull/Bear Line-in-the-Sand.
A drop and hold below 100 will ensure further weakness ahead in the SPX, while a drop and hold below 60 could produce a catastrophic drop in equities.
Either way, as long as price on this ratio remains below 150, we’ll see wild, large intraday swings in both directions on the SPX.
This volatility and weakness will likely not die down until price breaks and holds above the 200 New Bull Market Level.
Keep an eye on the RSI, MACD and PMO indicators for any signs of a reversal to support any further buying in the SPX…otherwise, look for volatility and weakness to remain elevated.
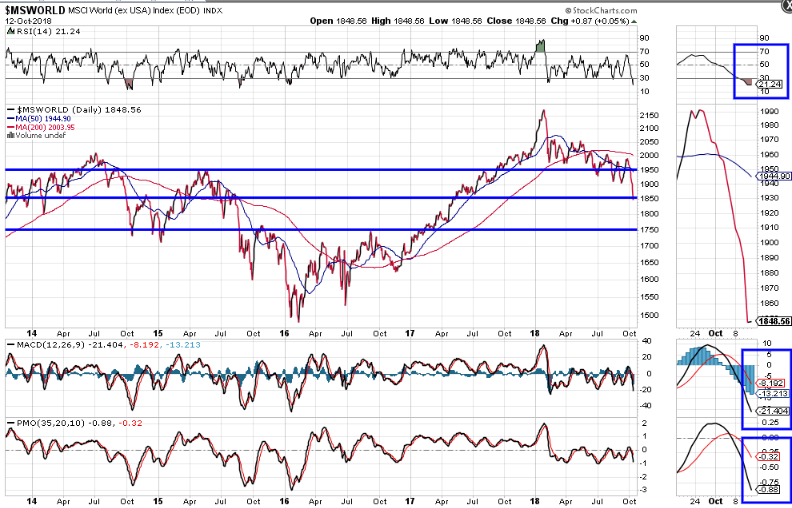
The World Market Index, which has lost 15% from its high on January 25 this year, is trading under the bearish influence of a moving average Death Cross formation, as shown on the following daily chart.
Price stopped just below a major support level of 1850 and sits squarely in between major resistance at 1950 and lower major support at 1750.
Watch for a possible reversal on the RSI, MACD and PMO indicators to support some kind of stabilization in this index…otherwise, look for volatility to remain elevated and for price to, potentially, retest the 1750 level. Such a scenario could very well drag U.S. equities further down, as well (and vice versa)…so, this is an important Index to monitor at this point.