
Big news, everyone! SlopeCharts now has volatility charts!
Not only can it plot volatility, but it offers this data in a wide variety of parameters. As with almost all new features from now on, I’m going to do the same thing:
- Launch it;
- Get feedback;
- Restrict its access to paying members (this happened recently with the Earnings Reaction page, which is now exclusively for Diamond members………Slope’s fastest-growing group)
So, for the moment, this is free for any of you to use.
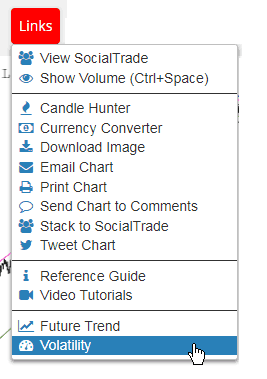
Using Volatility in SlopeCharts is very simple. First, choose Volatility from either the Menu or the Links, as shown below.
A dialog box will appear with a variety of choices:
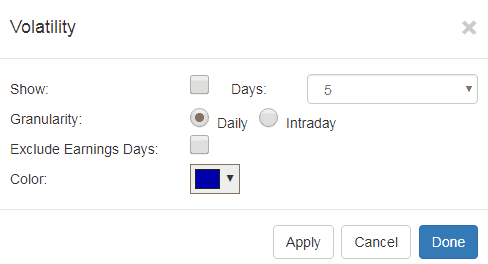
Here is what these choices mean, one by one:
- Show controls whether or not the volatility chart is displayed; check the checkbox to display the requested volatility chart in a pane of its own;
- Days controls how many days are used in the calculation of the volatility; the longer the period, the less volatile and more smooth the volatility graph itself will be;
- Granularity dictates whether the volatility is calculated based on day-to-day data or, for more precision, the intraday ticks;
- Exclude Earnings Days can be checked if you want volatility to be calculated without taking into account the typically extra-volatile period surrounding earnings announcements;
- Color lets you choose from any of thousands of colors for the display of the graph
If you want to experiment with different settings, you can click the Apply button and see the effect without closing the dialog box. Once you are satisfied with your choices, you can click Done.
Here, for example, is Nvidia’s stock chart with its volatility graph; as you can see, the volatility chart includes information about what precisely it is you are looking at.

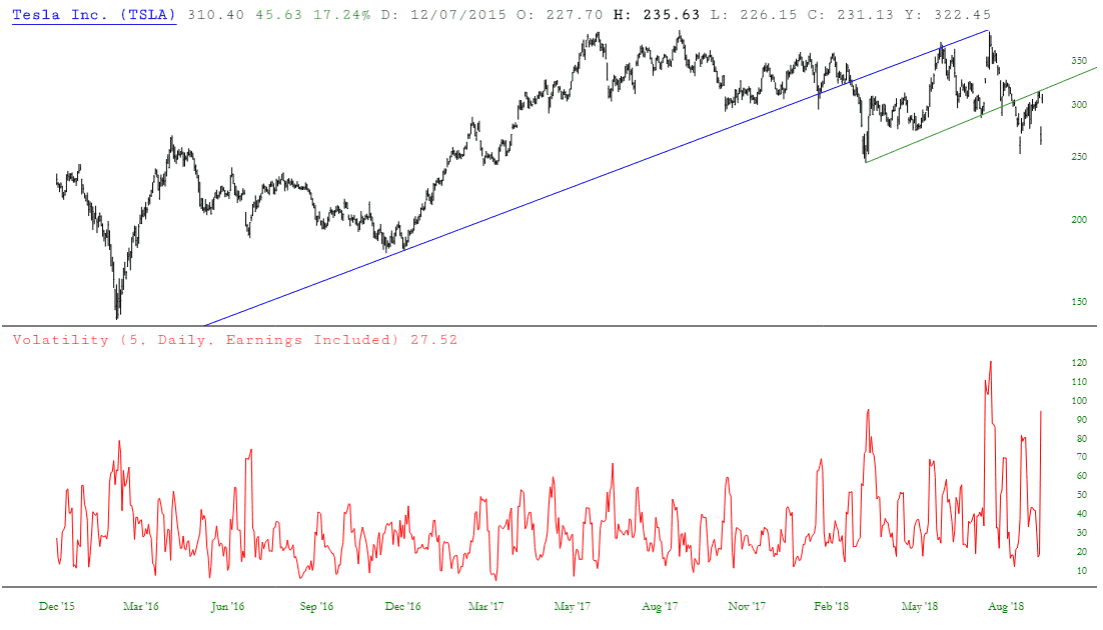
Here is another example with Tesla:
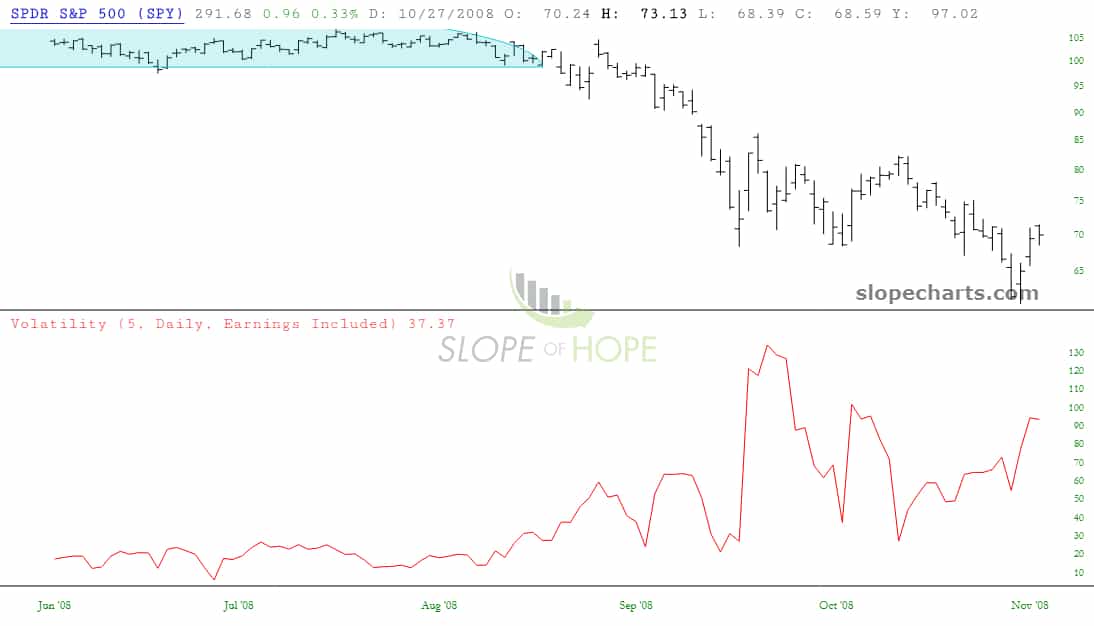
And, for a good example of an instrument that experienced an explosion in volatility, here is the SPY during the financial crisis of 2008.
I am very eager to hear your feedback, so please leave comments below or, even better, email me. I hope you enjoy this awesome new feature in SlopeCharts!
