
In my last post I was talking about the touch of the rising wedge support trendline that I’d been looking for, and the bull flag that was forming on SPX, that should break up today if not seen on Friday. SPX gapped up through flag resistance at the open today, and the minimum flag target is a retest of the all time high, not seen today but likely coming soon. On the video I was talking about a backtest, which we are watching now, and the ideal target for that would be a backtest of broken flag resistance, currently in the 2922 SPX area. The next possible target below would be a gapfill into Friday’s close at 2913.98.
Partial Premarket Video from theartofchart.net – Update on ES, NQ, SPX, NDX, RUT:
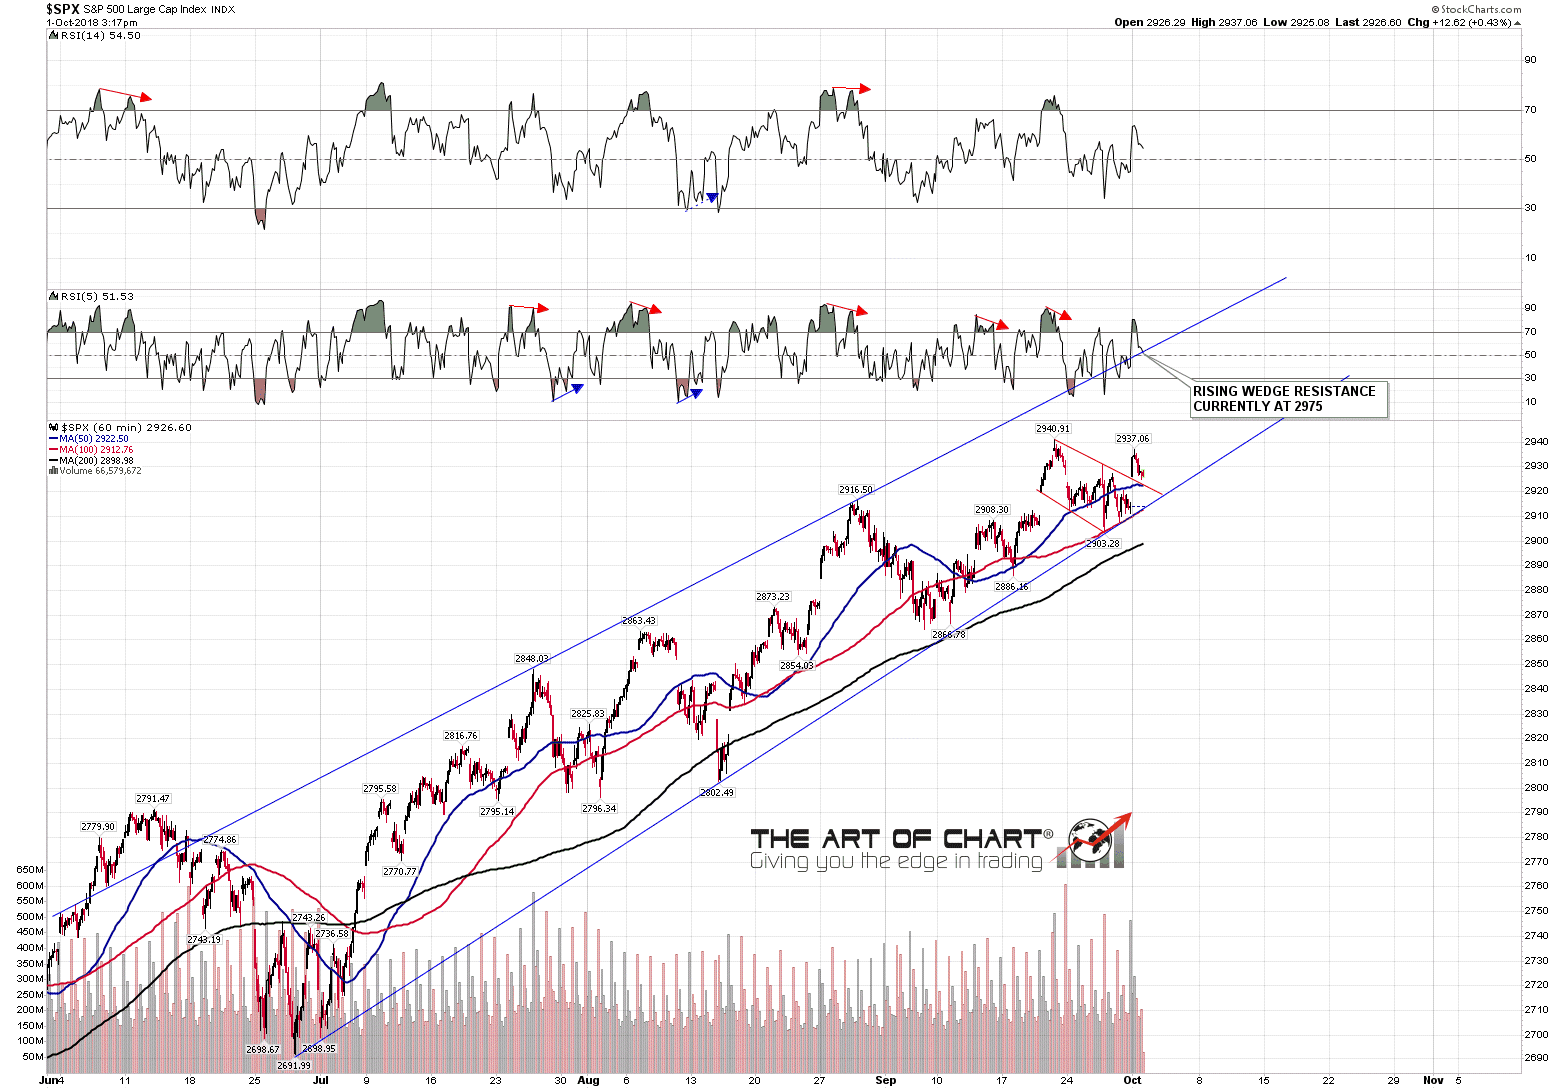
I’m not showing the usual SPX hourly chart today because I was talking about the need to test rising wedge support for a couple of weeks before it was hit, and I wanted to show the clean trendlines on this pattern. This really is a beautifully formed rising wedge. The next target within the wedge, as long as wedge support is not broken first of course, is rising wedge resistance, currently in the 2975 area and rising of course. If hit, I’m expecting to see that in the next seven to ten days and that should deliver a significant high under main SPX trendline resistance from 2009, currently in the 3000 area. That main resistance trendline could be tested, but doesn’t need to be. SPX 60min chart:
We are doing our monthly free public Chart Chat webinar on Sunday covering the usual very wide range of markets and instruments, and if you’d like to attend, you can register for that on our October Free Webinars page.
