
OK, this product is getting a little momentum behind it! I am pleased to tell you that SlopeRules (accessible via SlopeCharts) now has Edit and Delete functions, which means you can – – well – – edit and delete SlopeRules sets now. It sounds basic, but it’s obviously important…….and it’s ready!
SlopeRules is a tool on the Slope of Hope which lets you create a trading system using discrete technical rules. It is deliberately designed to be intuitive and very simple to use, and it is closely integrated with the SlopeCharts platform.
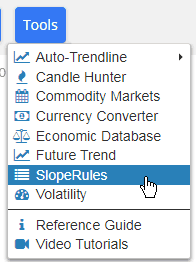
To create a rule set, choose SlopeRules from the Tools menu within SlopeCharts.
You will be presented with a dialog box, with the following components:
- Name: this dropdown has the names of all the SlopeRules you have made already. You can select any prior SlopeRules, or you can leave it on the default, New Rule, if you want to make a new set;
- Action: a dropdown which is either Buy Long or Sell Short;
- Opening Conditions: this is where you establish all the conditions which will instigate taking trading action;
- Closing Conditions: this is where you establish all the conditions which instigates closing your trade

The most important part of the dialog box is, of course, the rules themselves. Each rule you create is a simple condition which is either True or False, such as whether the 50-day simple moving average is above the 200-day simple moving average, or whether the Closing Price of a security crosses beneath the 200-day exponential moving average.
You may want to create your own custom value instead of using one of the predefined ones. Choose “New Value” from the dropdown of rules, and this new dialog box will appear:
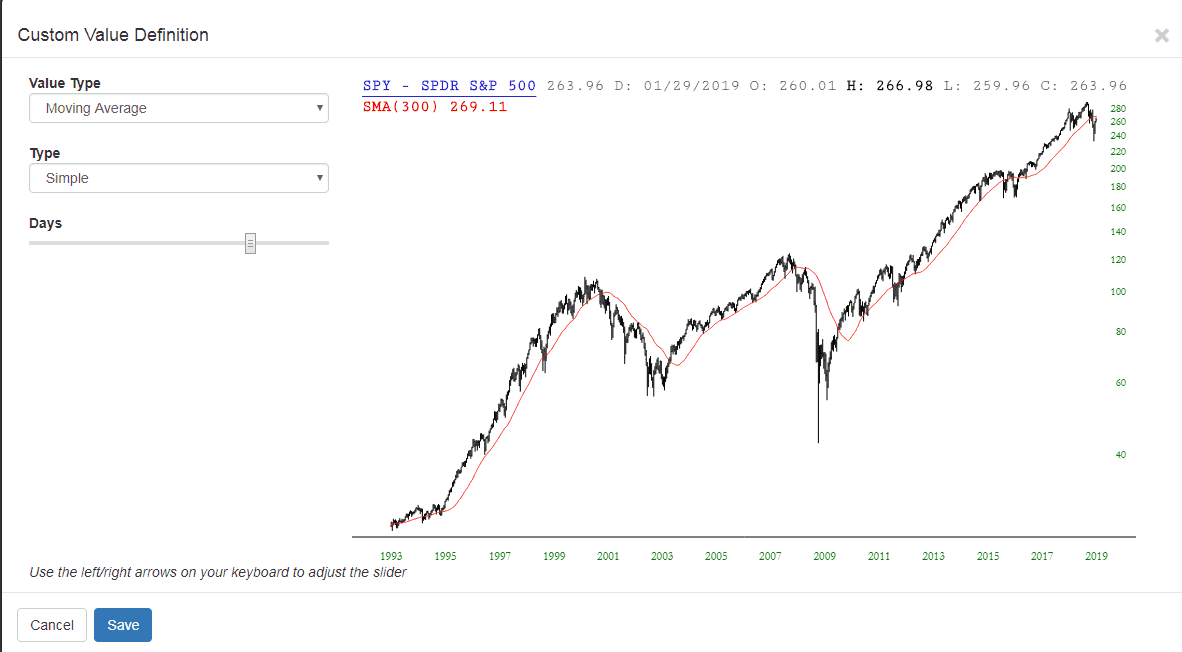
It is here you can create your own custom rule. For example, you create a 225-day exponential moving average, you would:
- Choose “Moving Average” as the Value Type;
- Choose “Exponential’ as the Type
- Slide the slider bar until you got to 225 (if you need to nudge the value up or down, you can use the arrow keys on your keyboard to fine-tune the slider’s motion)
- Click Save, and that new definition will be available.
Once you have set up the parameters for opening and closing a trade, click Save, and SlopeRules asks you to give your rule set a name.
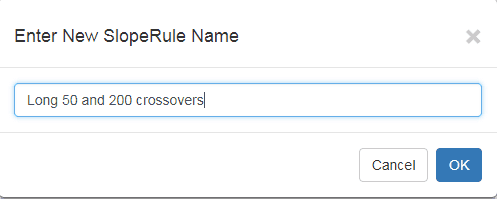
At this point, this set of SlopeRules is immediately available for use, as well as any others you have created.
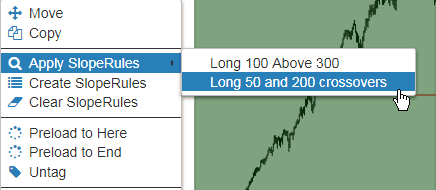
To apply SlopeRules, right-click on any symbol in your watchlist and choose what you want to apply.
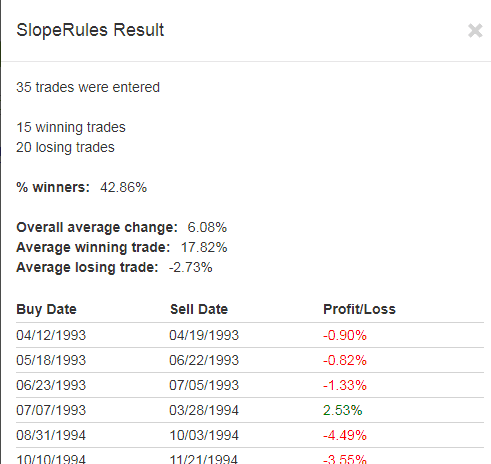
Your rules will be applied to the entire historical dataset of whatever security you selected, and the results will be shown in a dialog box. You will see the total number of trades, how many winning and losing traders their were, what percentage of trades were winners, and what their respective and average percentages were. You will also see the entry and exit dates as well as the Profit/Loss for each one.
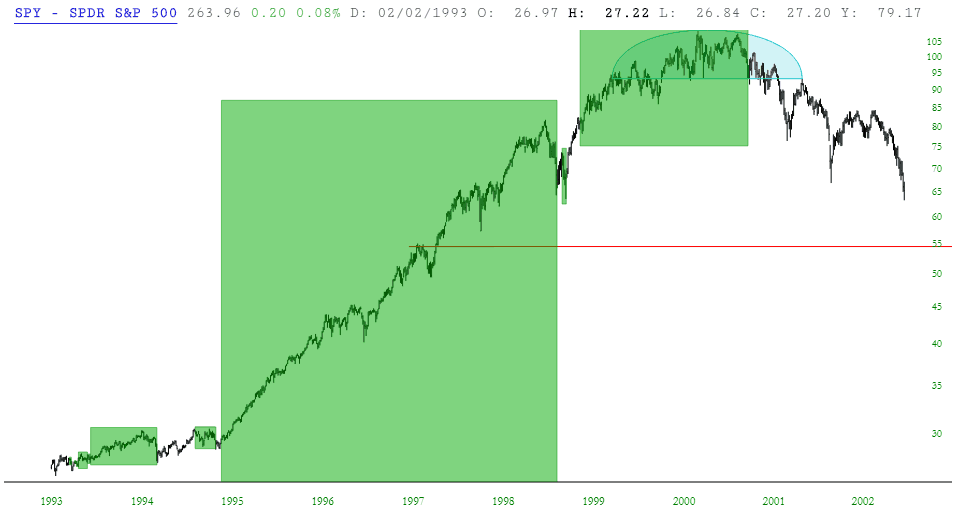
You will also be presented with all the trades in graph form. For long positions, these are shown as green rectangles. This lets you get a sense as to how good your rules are, since you want a rule set that maximizes profit without missing too many opportunities.
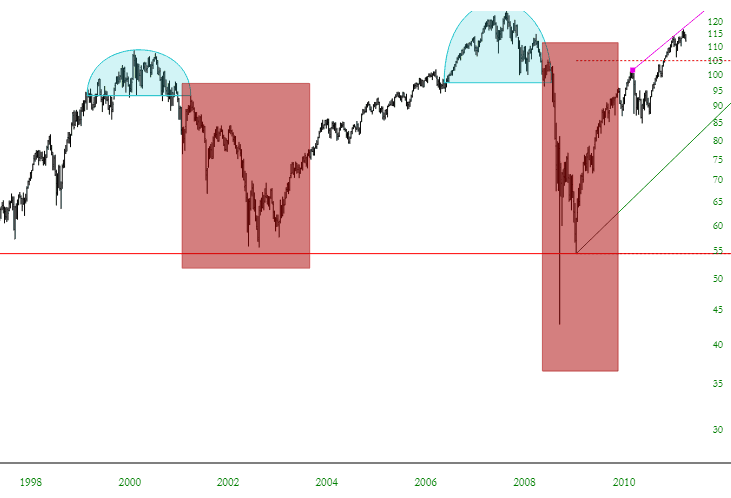
For SlopeRules that are short sales, the rectangles appear in red instead.
If you want to preserve any of the “trade rectangles”, right click on it and choose “Keep This.” When you want to erase all the trade rectangles from the chart, just right-click the symbol in the watchlist again and choose:

