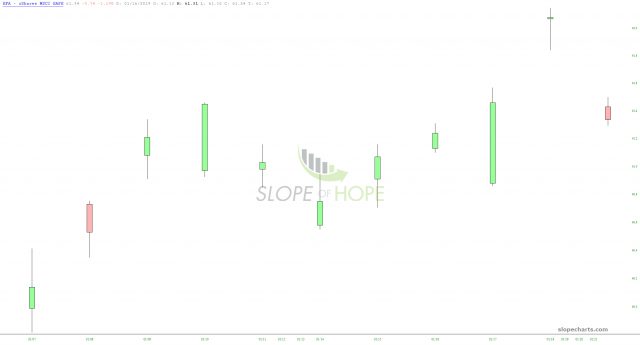
The symbol EFA in SlopeCharts represents large- and mid-cap securities outside the U.S. and Canada. We have witnessed an island reversal pattern on this one:
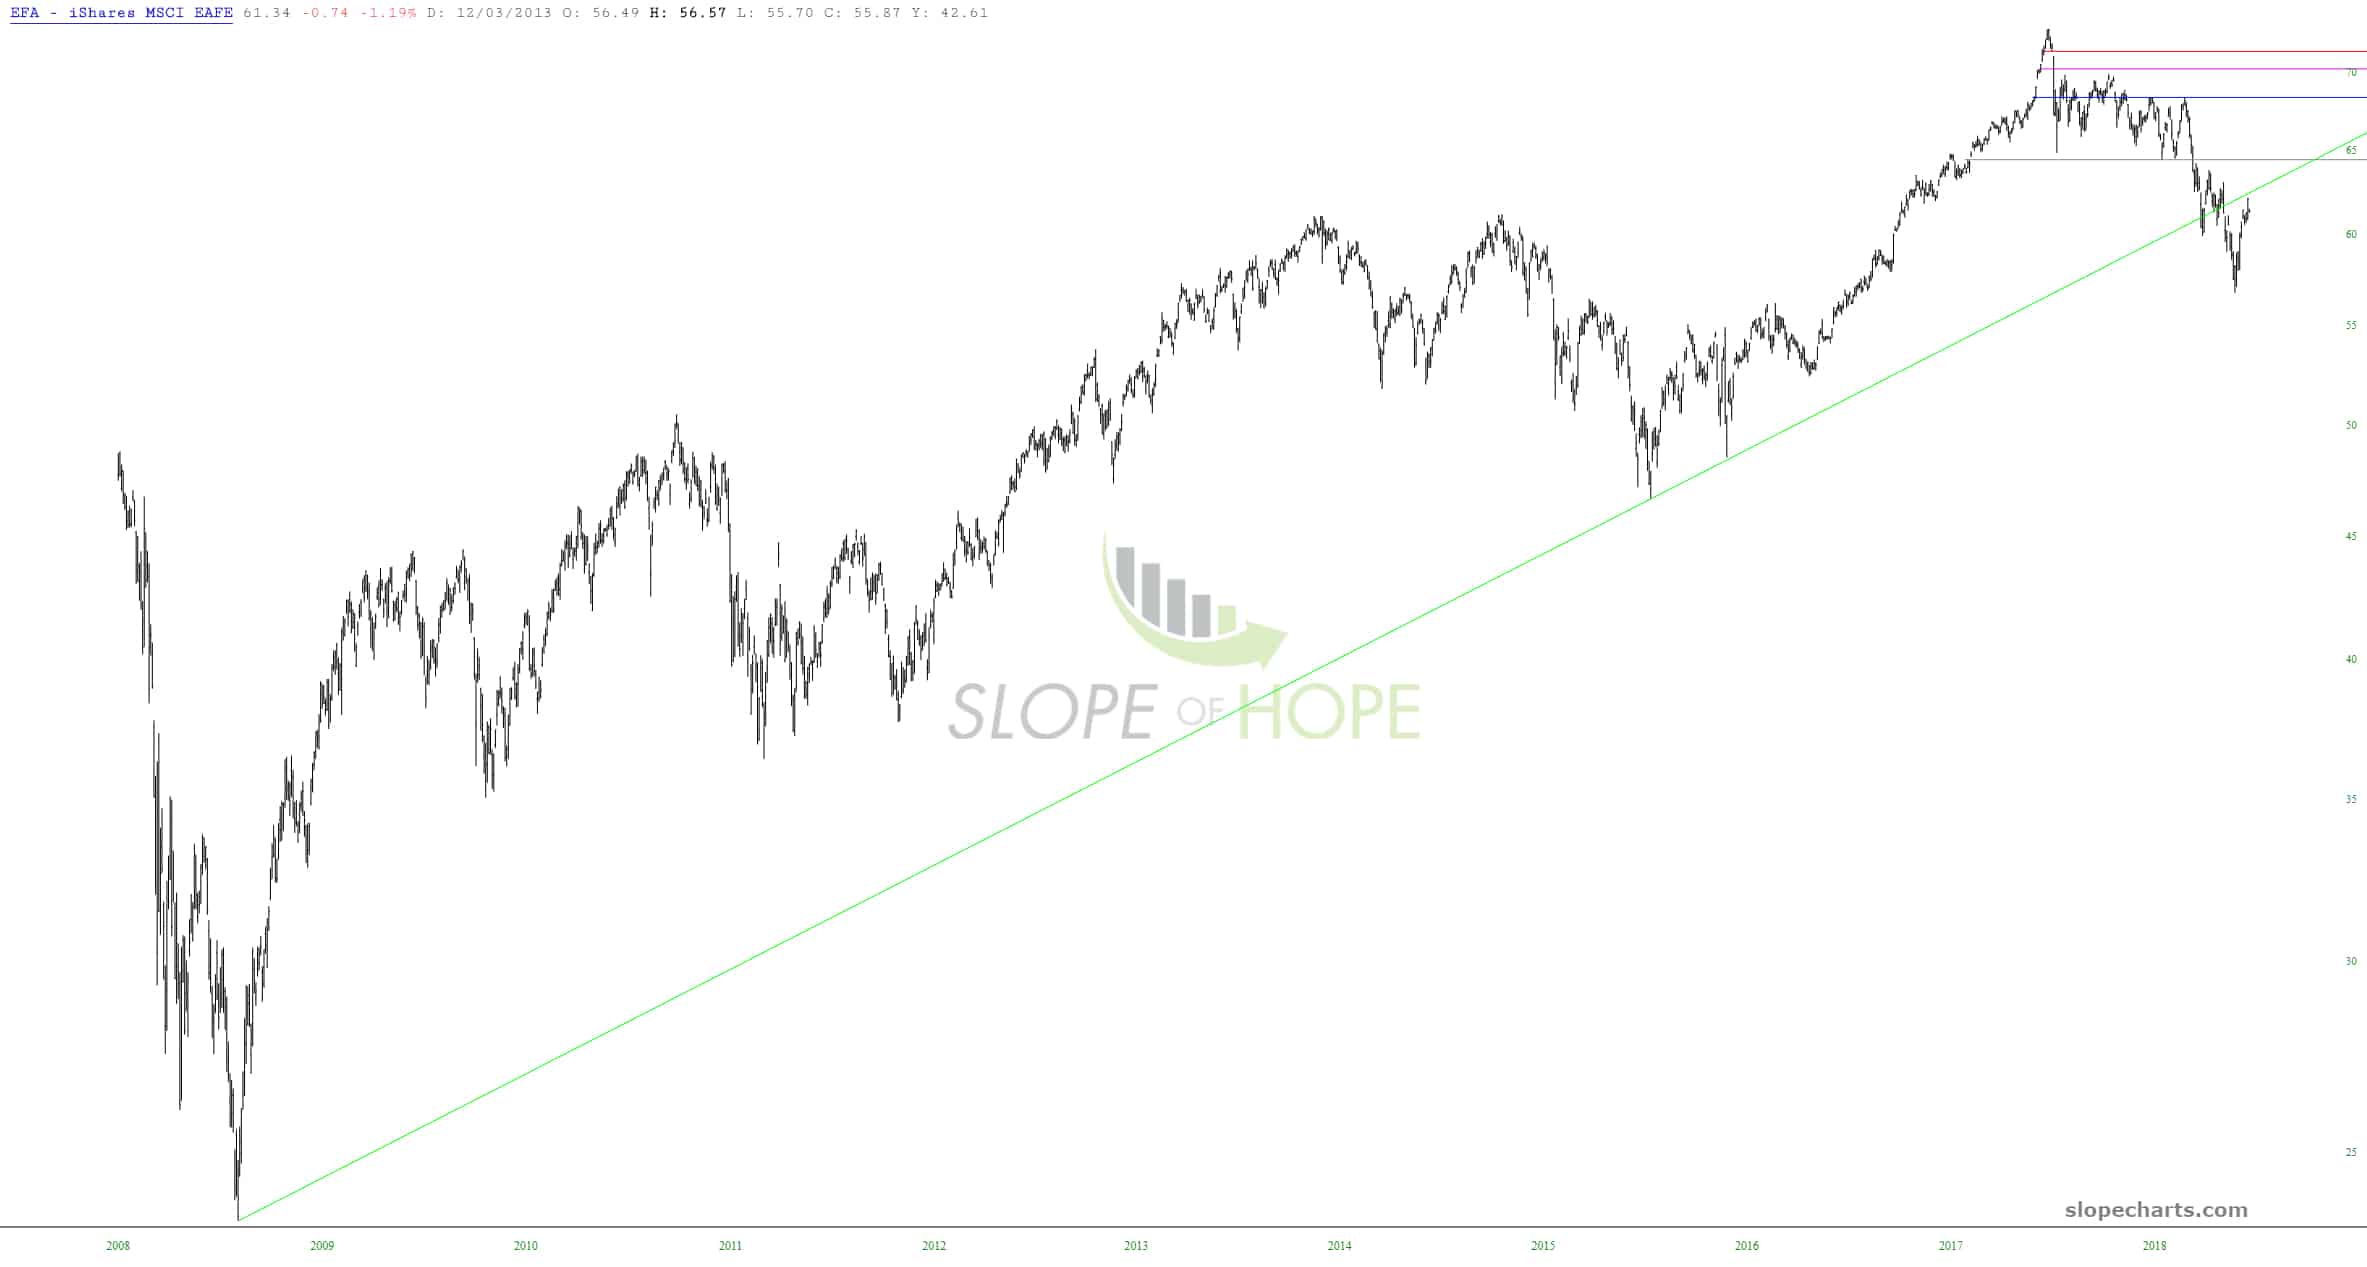
Looking at the bigger picture, you can see that this security perfectly tagged its now-broken trendline, which is symptomatic of just about everything I am seeing these days: that is, securities which have simply rallied back to their failure points, only to trap the bulls once again.