It hasn’t exactly been a newsworthy, awe-inspiring day, so I went through my fifty ETF charts and plucked out eight I thought were worthy of a few words. So here we go (click on any for big version):
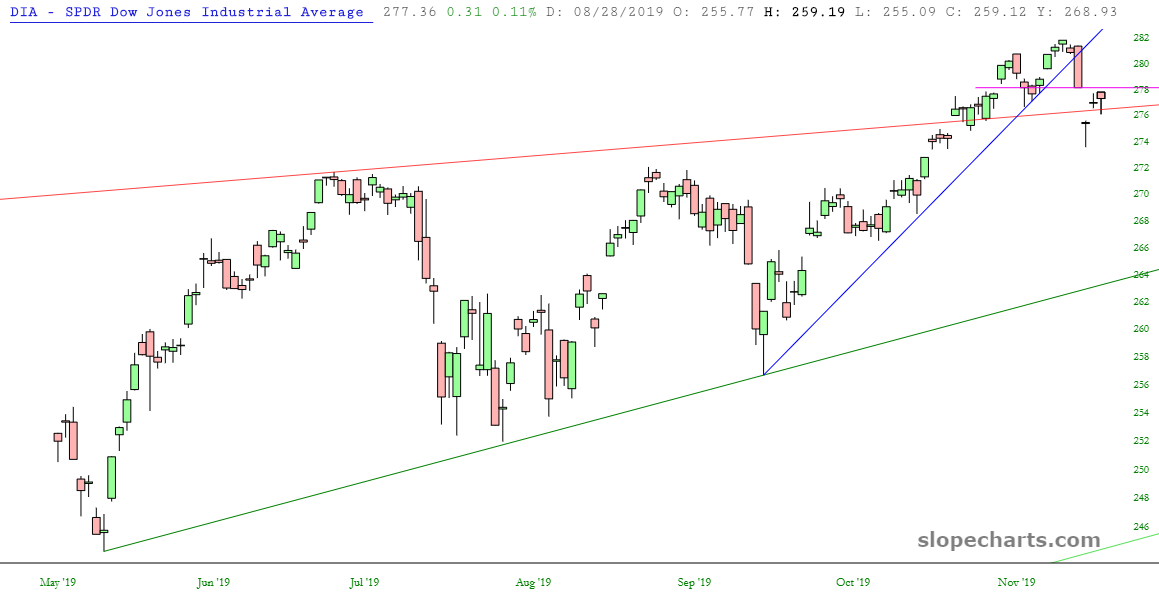
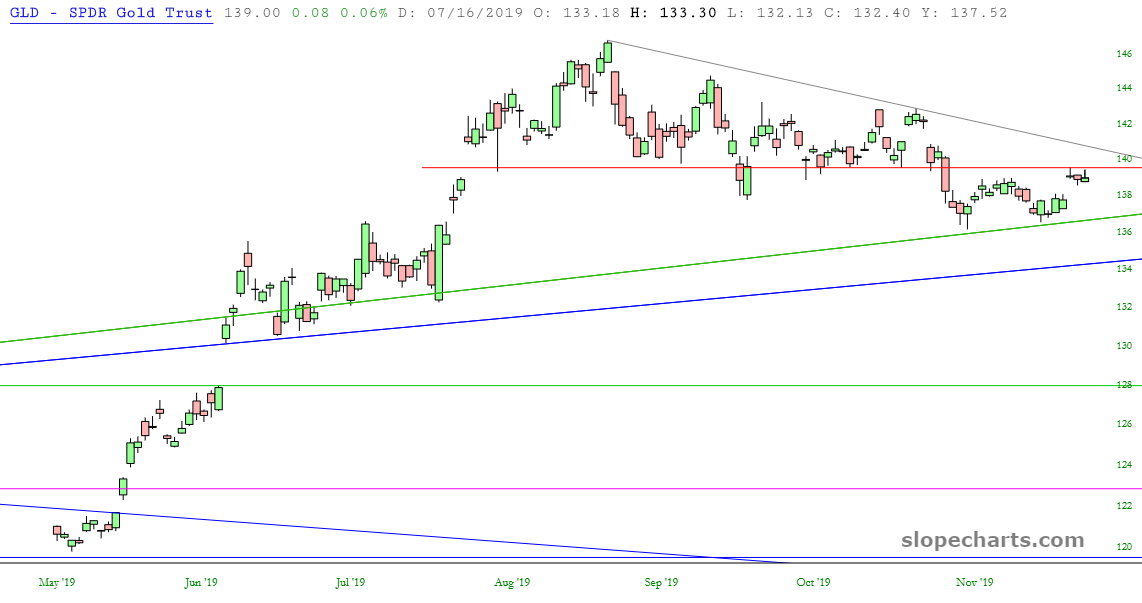
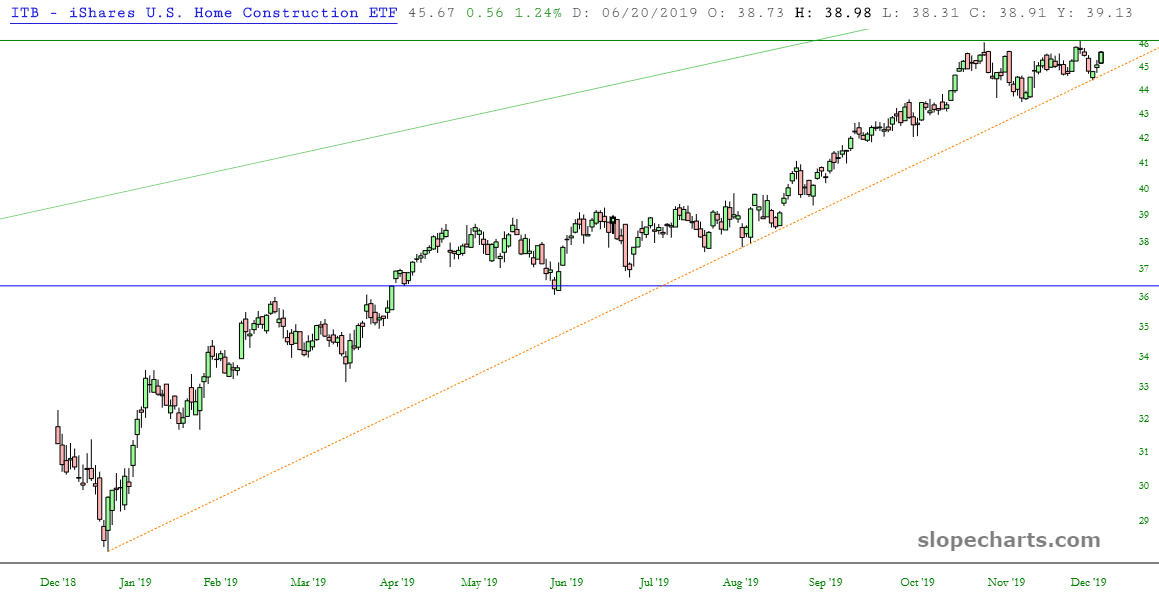
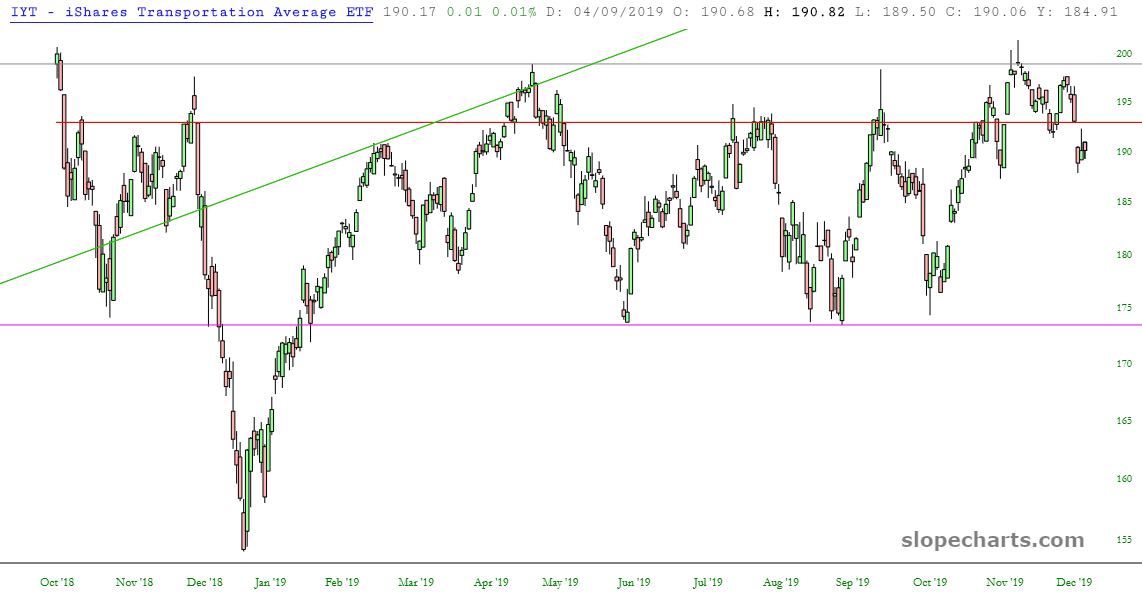
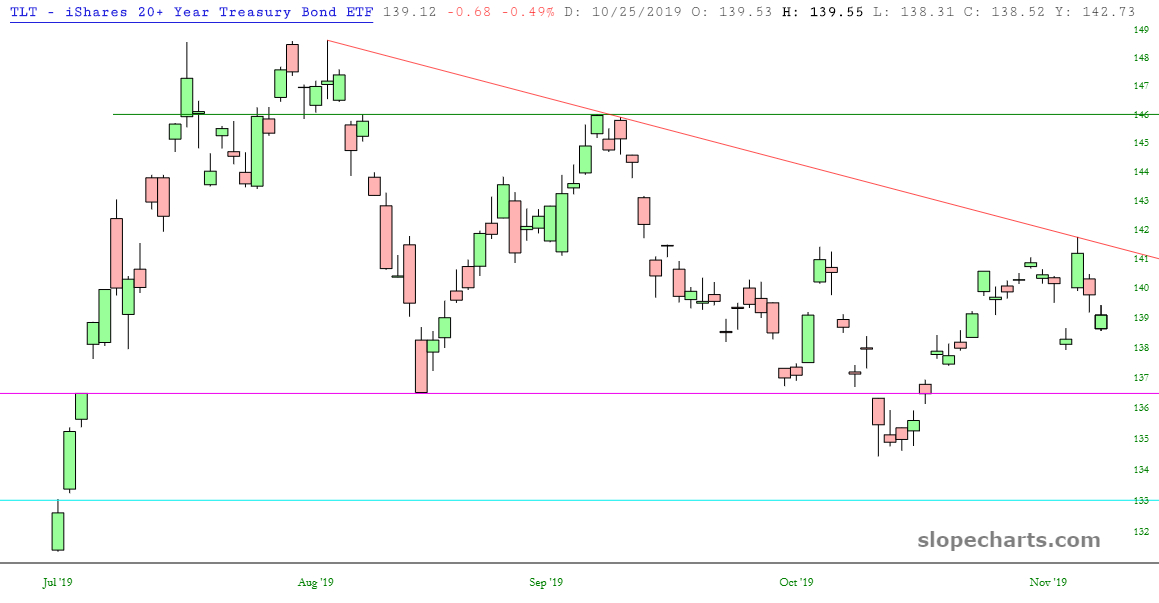
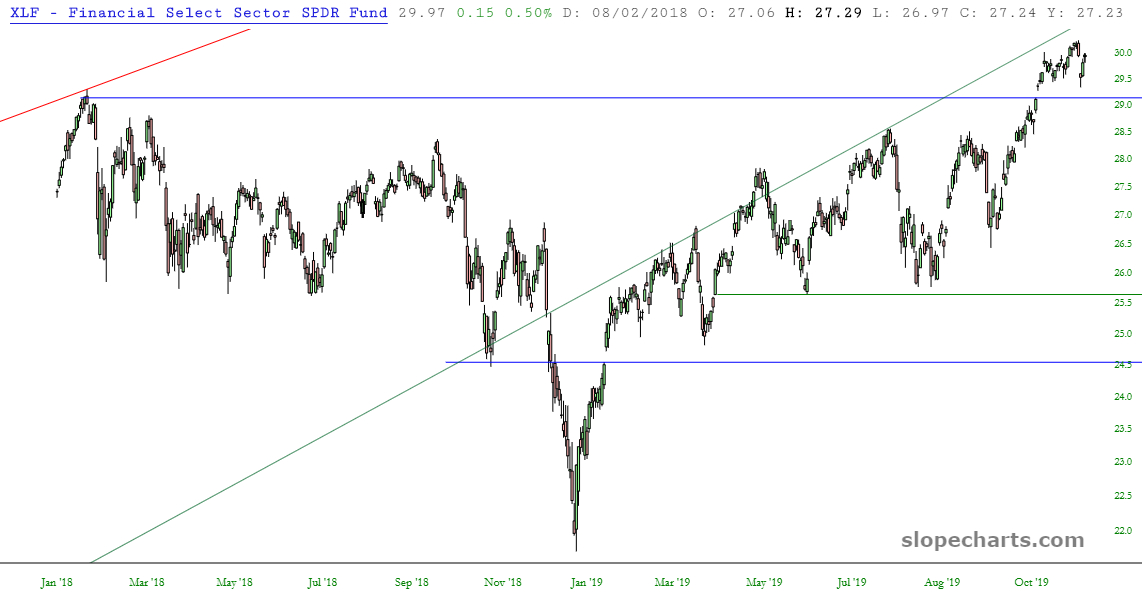
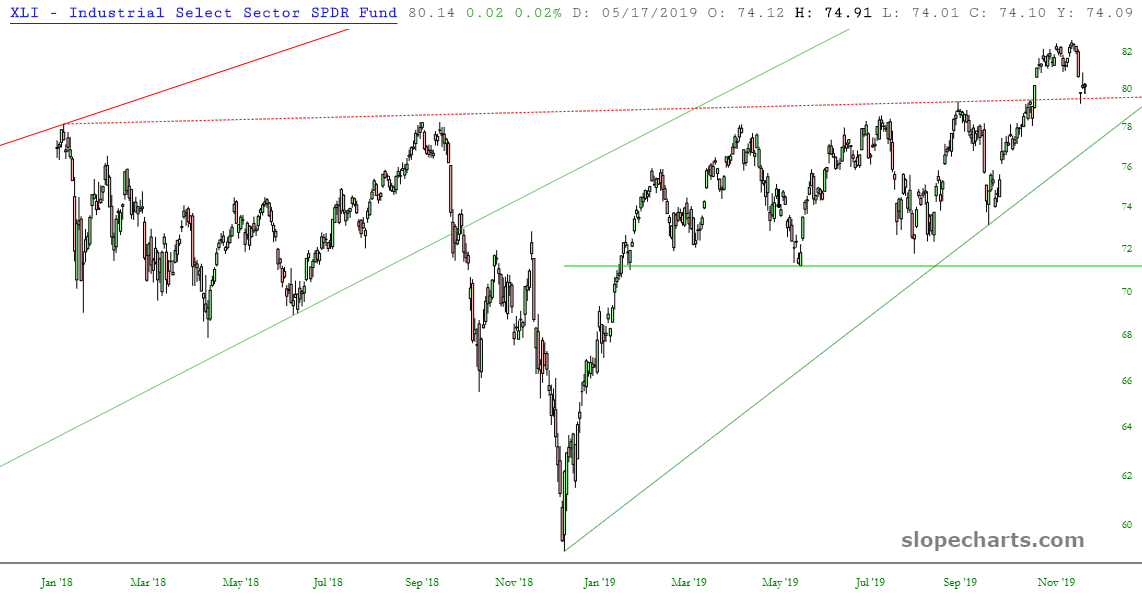
DIA: broke its medium-term uptrend a few days ago; still below its price gapGLD: needs to conquer that horizontal resistance and, more importantly, the descending trendline in order to escape the clutches of its right triangle patternITB: still a solid bullish uptrendIWM: range-bound for over an entire year, but a recent bullish breakoutIYT: still range-bound, and has remained below the price gap created a few days agoTLT: as mentioned to gold/diamond members two days ago, this tagged its descending trendline perfect; it needs to break above it to help out any surviving equity bearsXLF: financials have also broken above a large base; bullishXLI: industrials, similar to financials, have broken above bullish base