
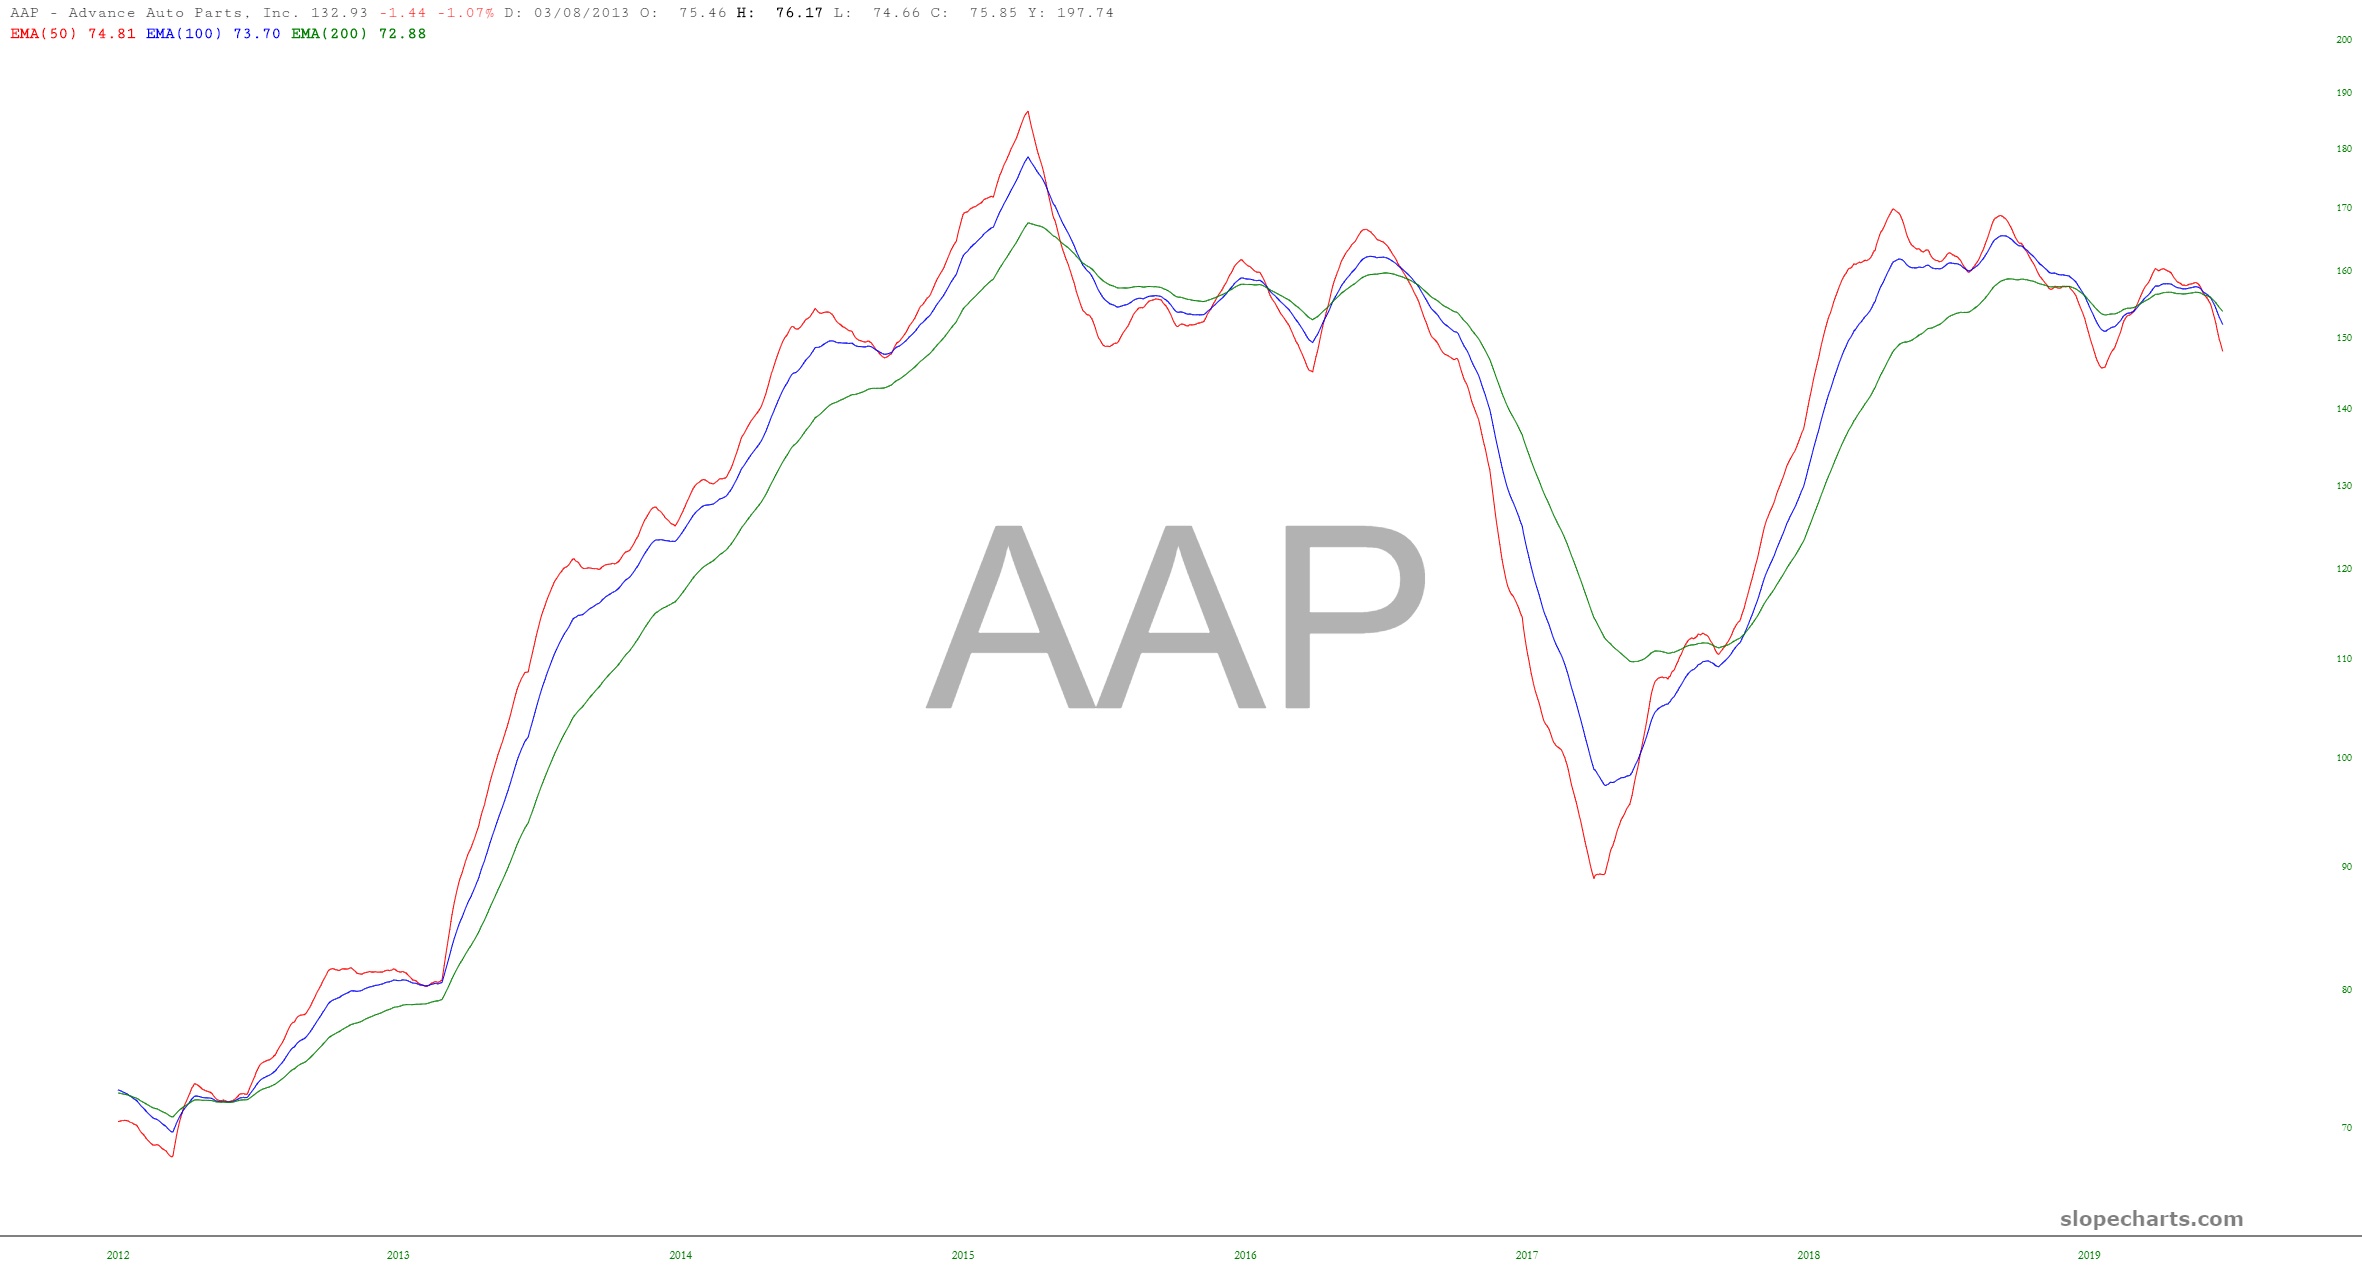
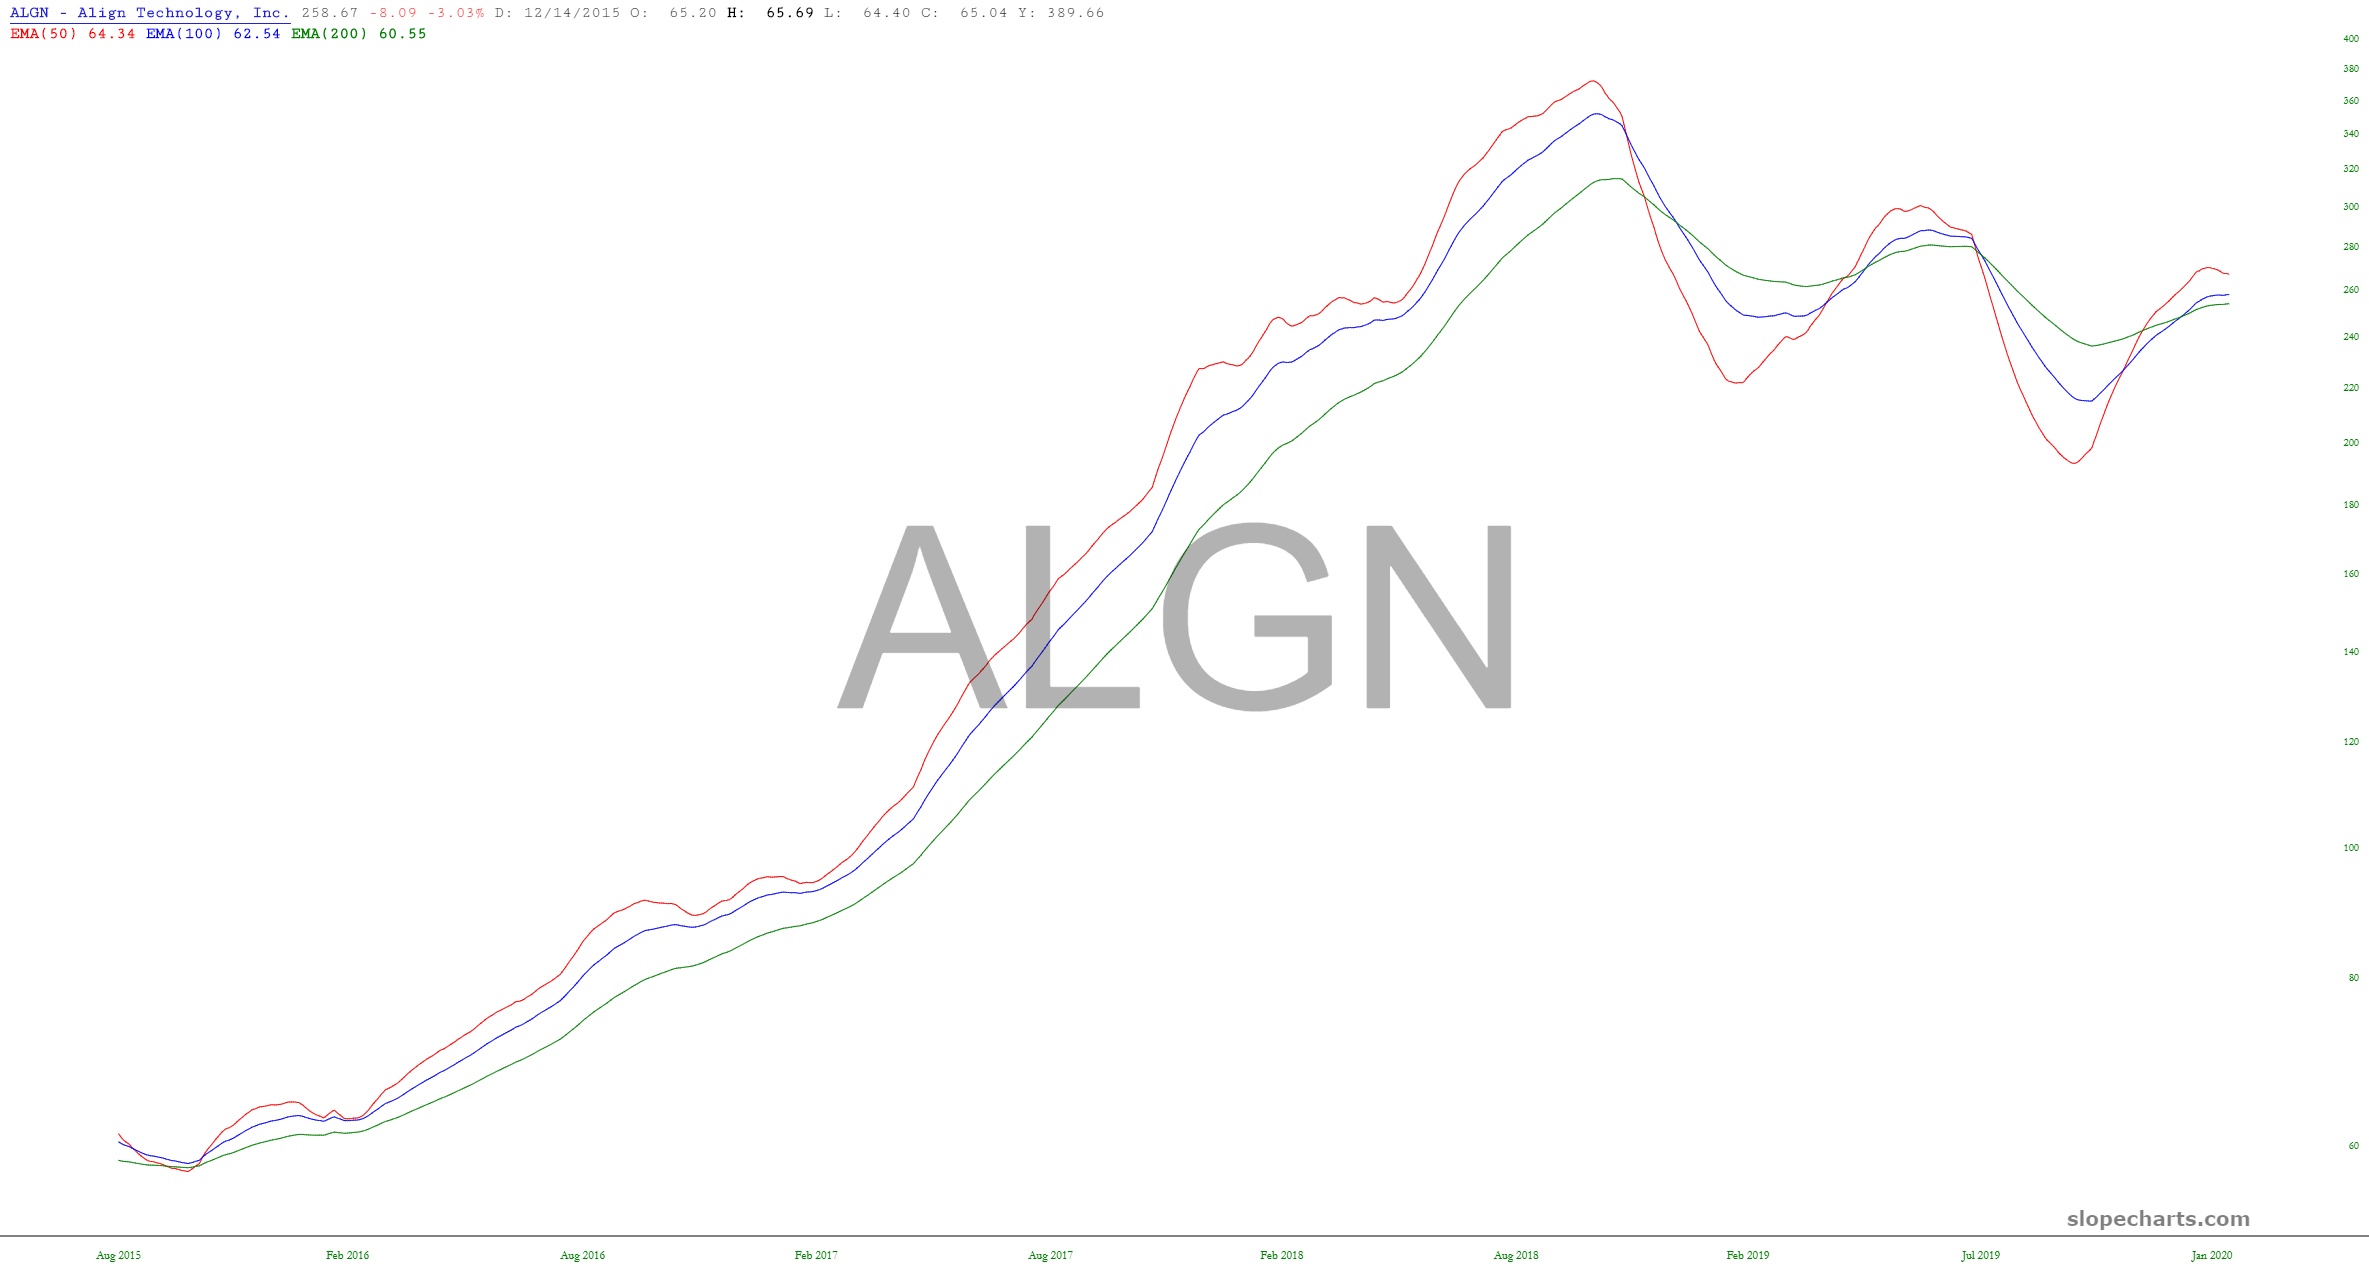
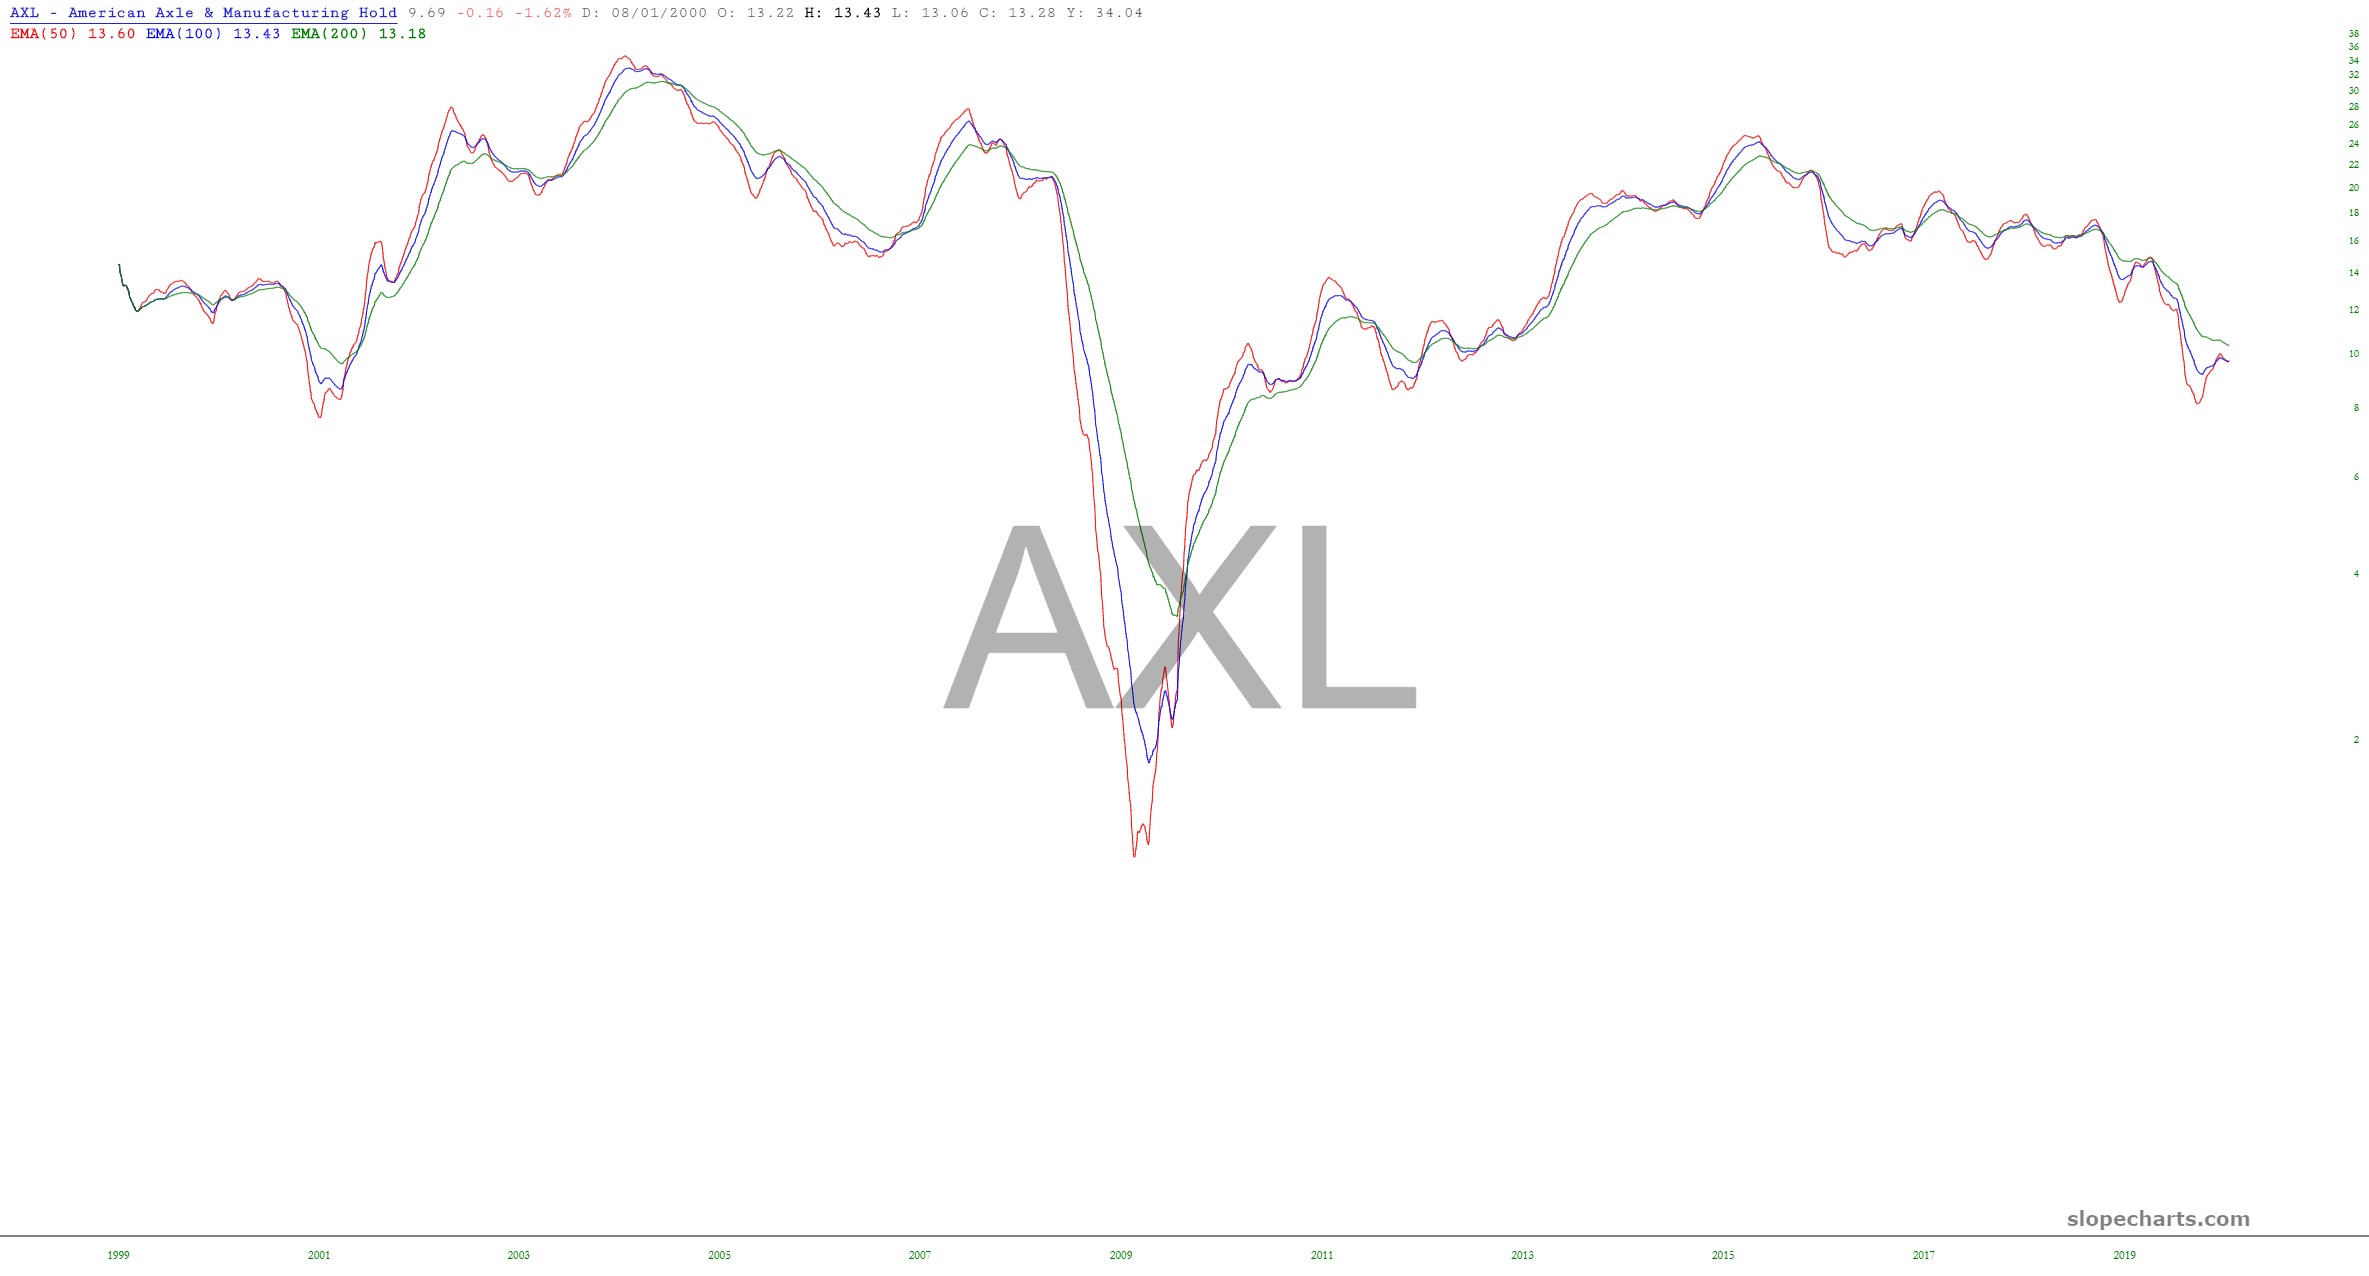
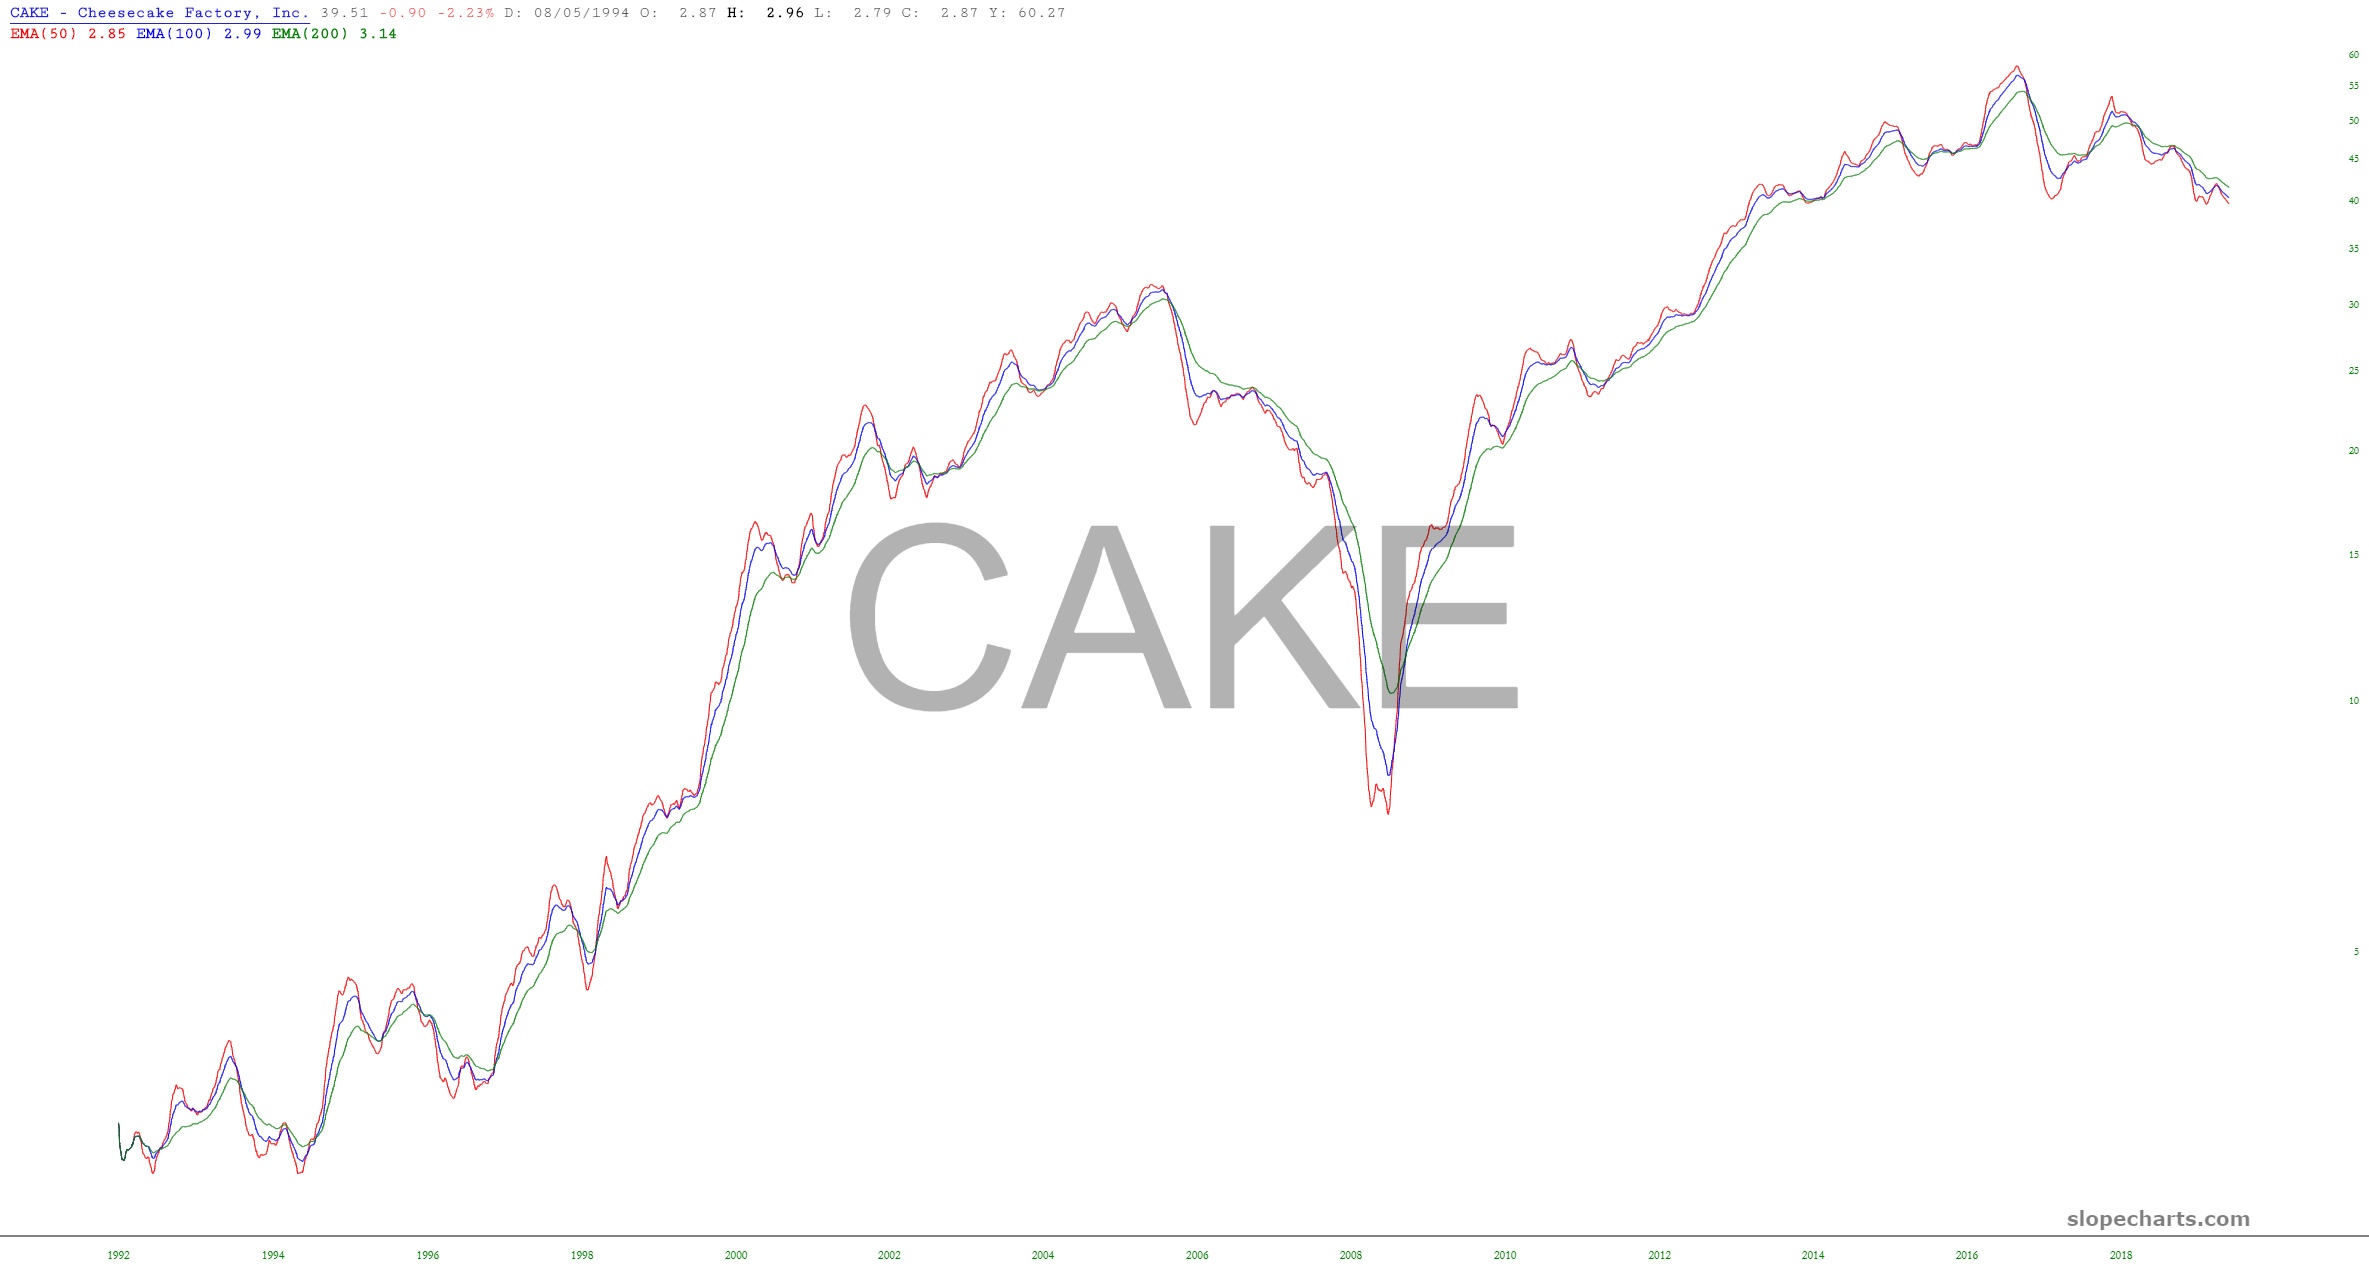
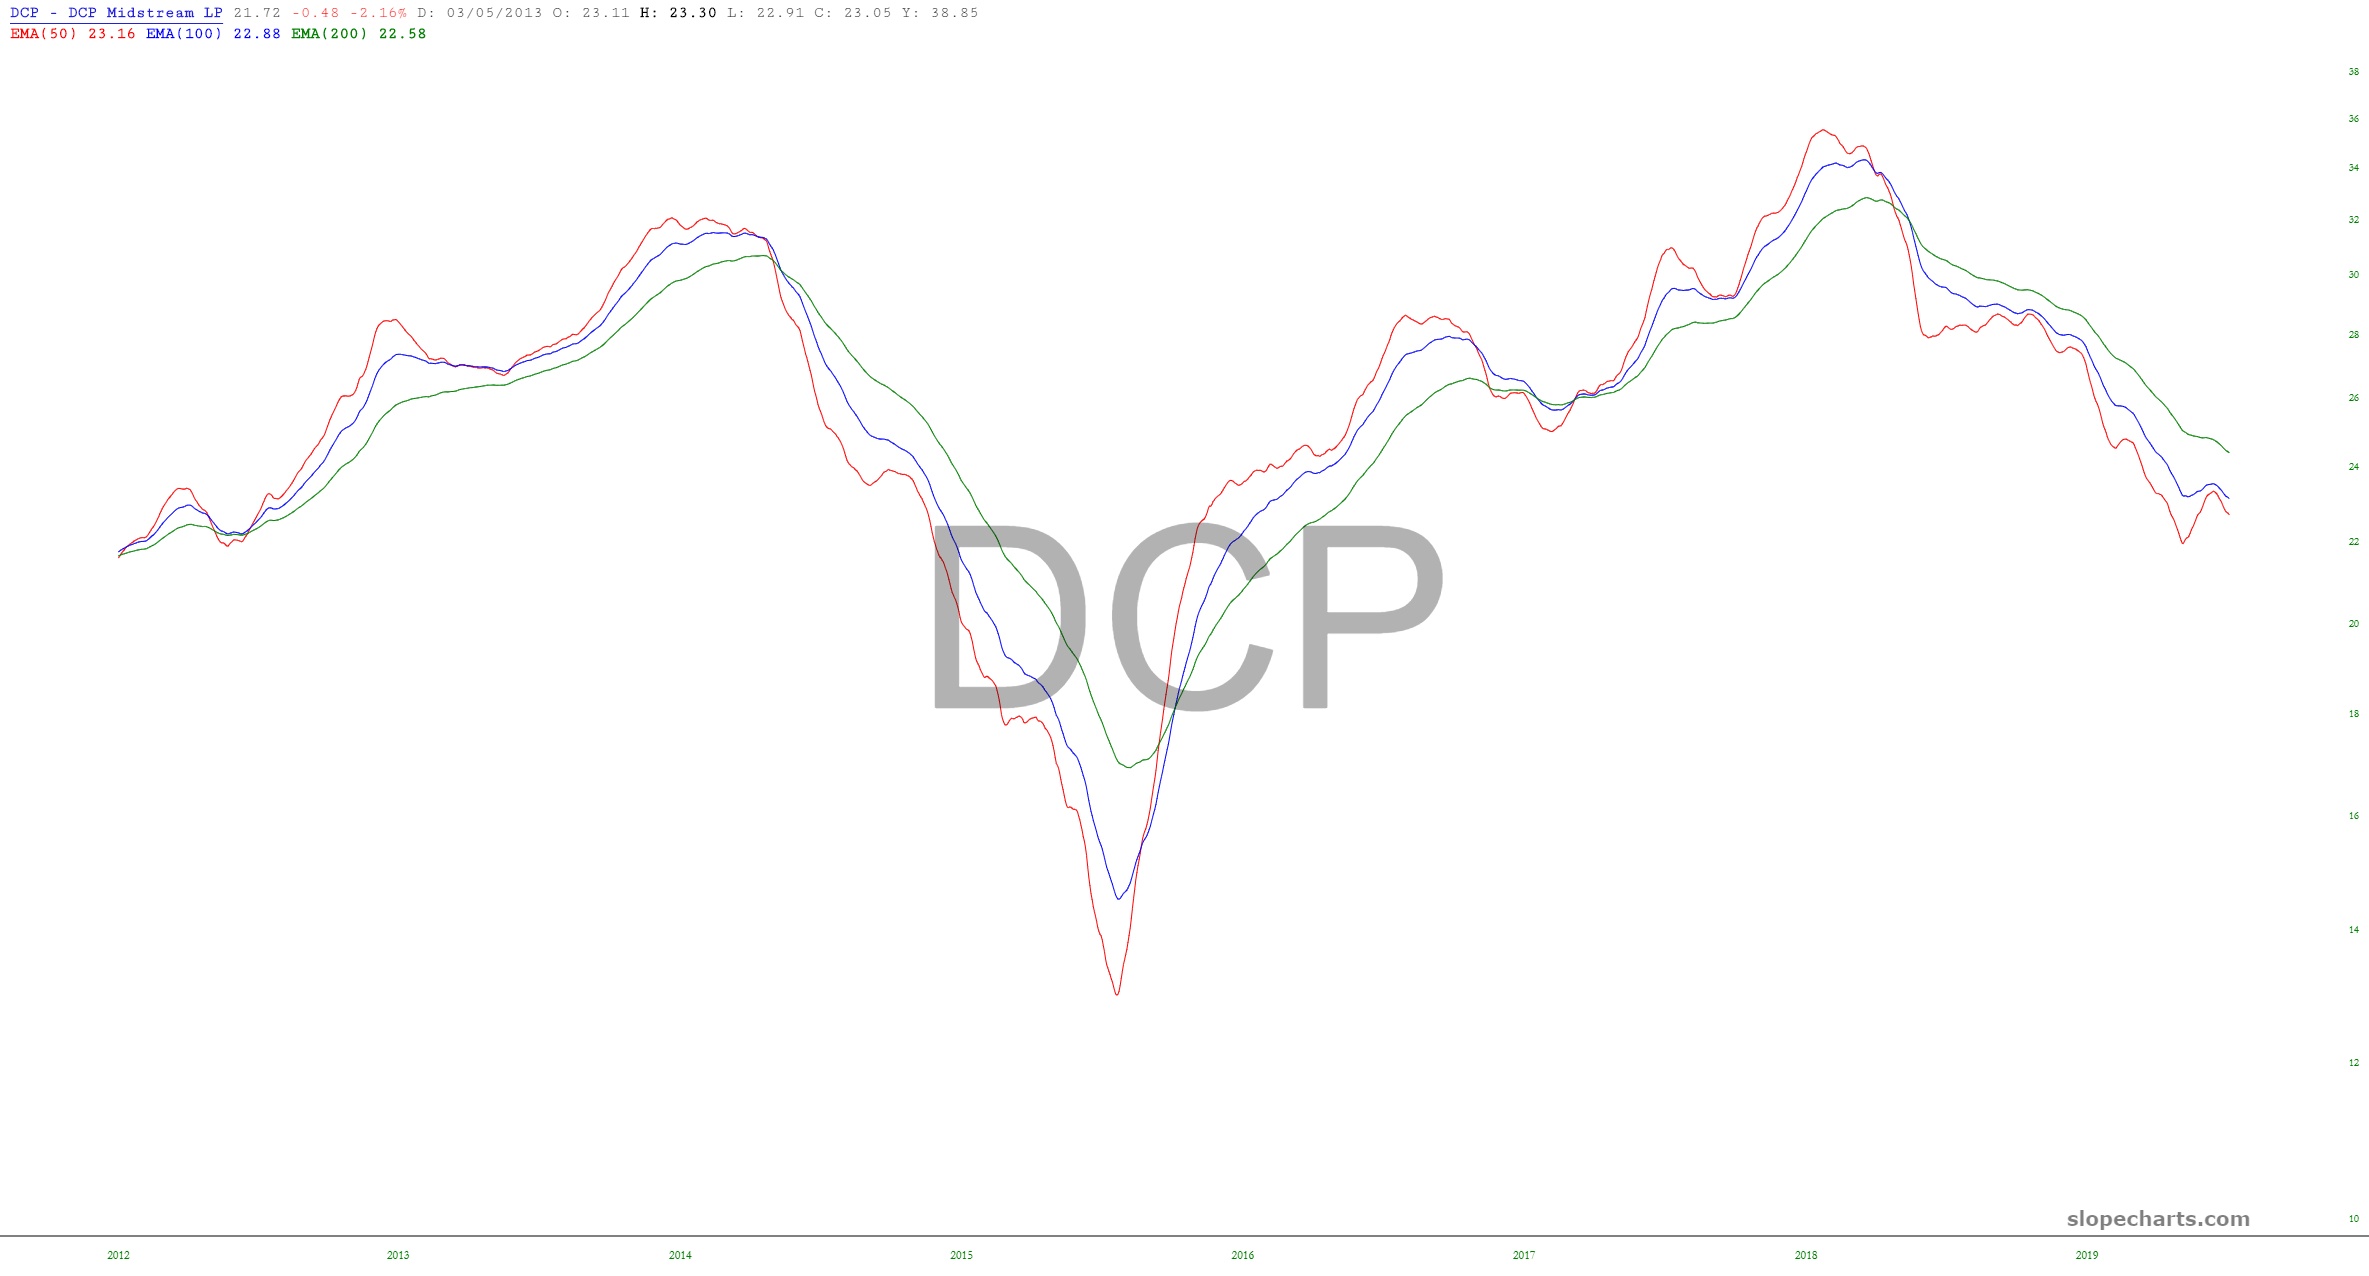
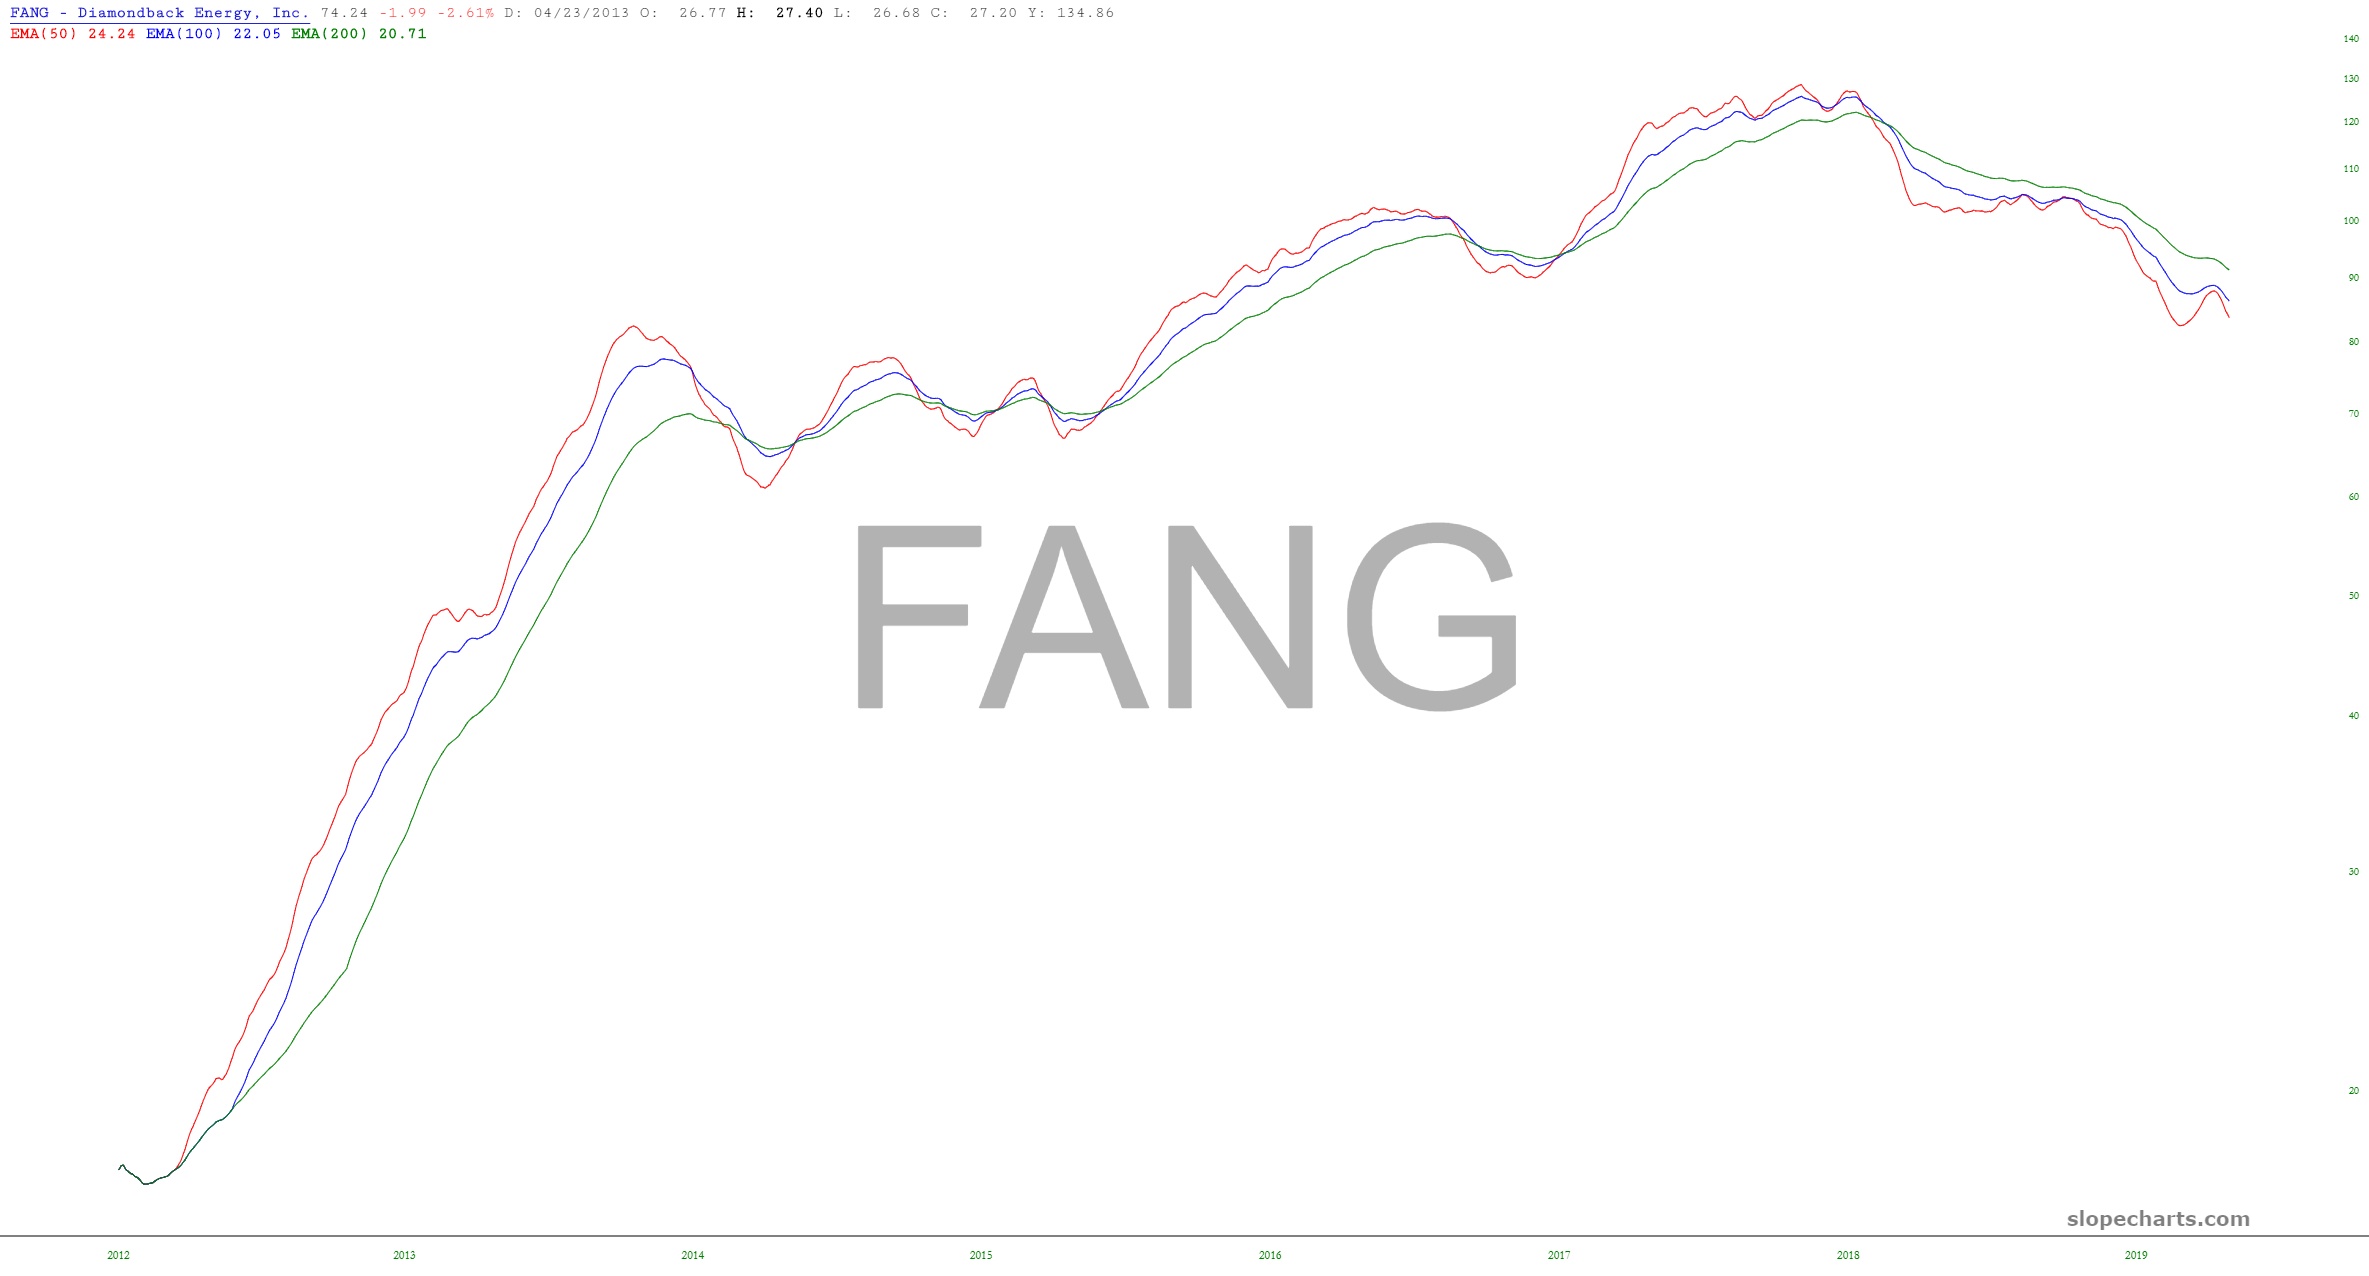
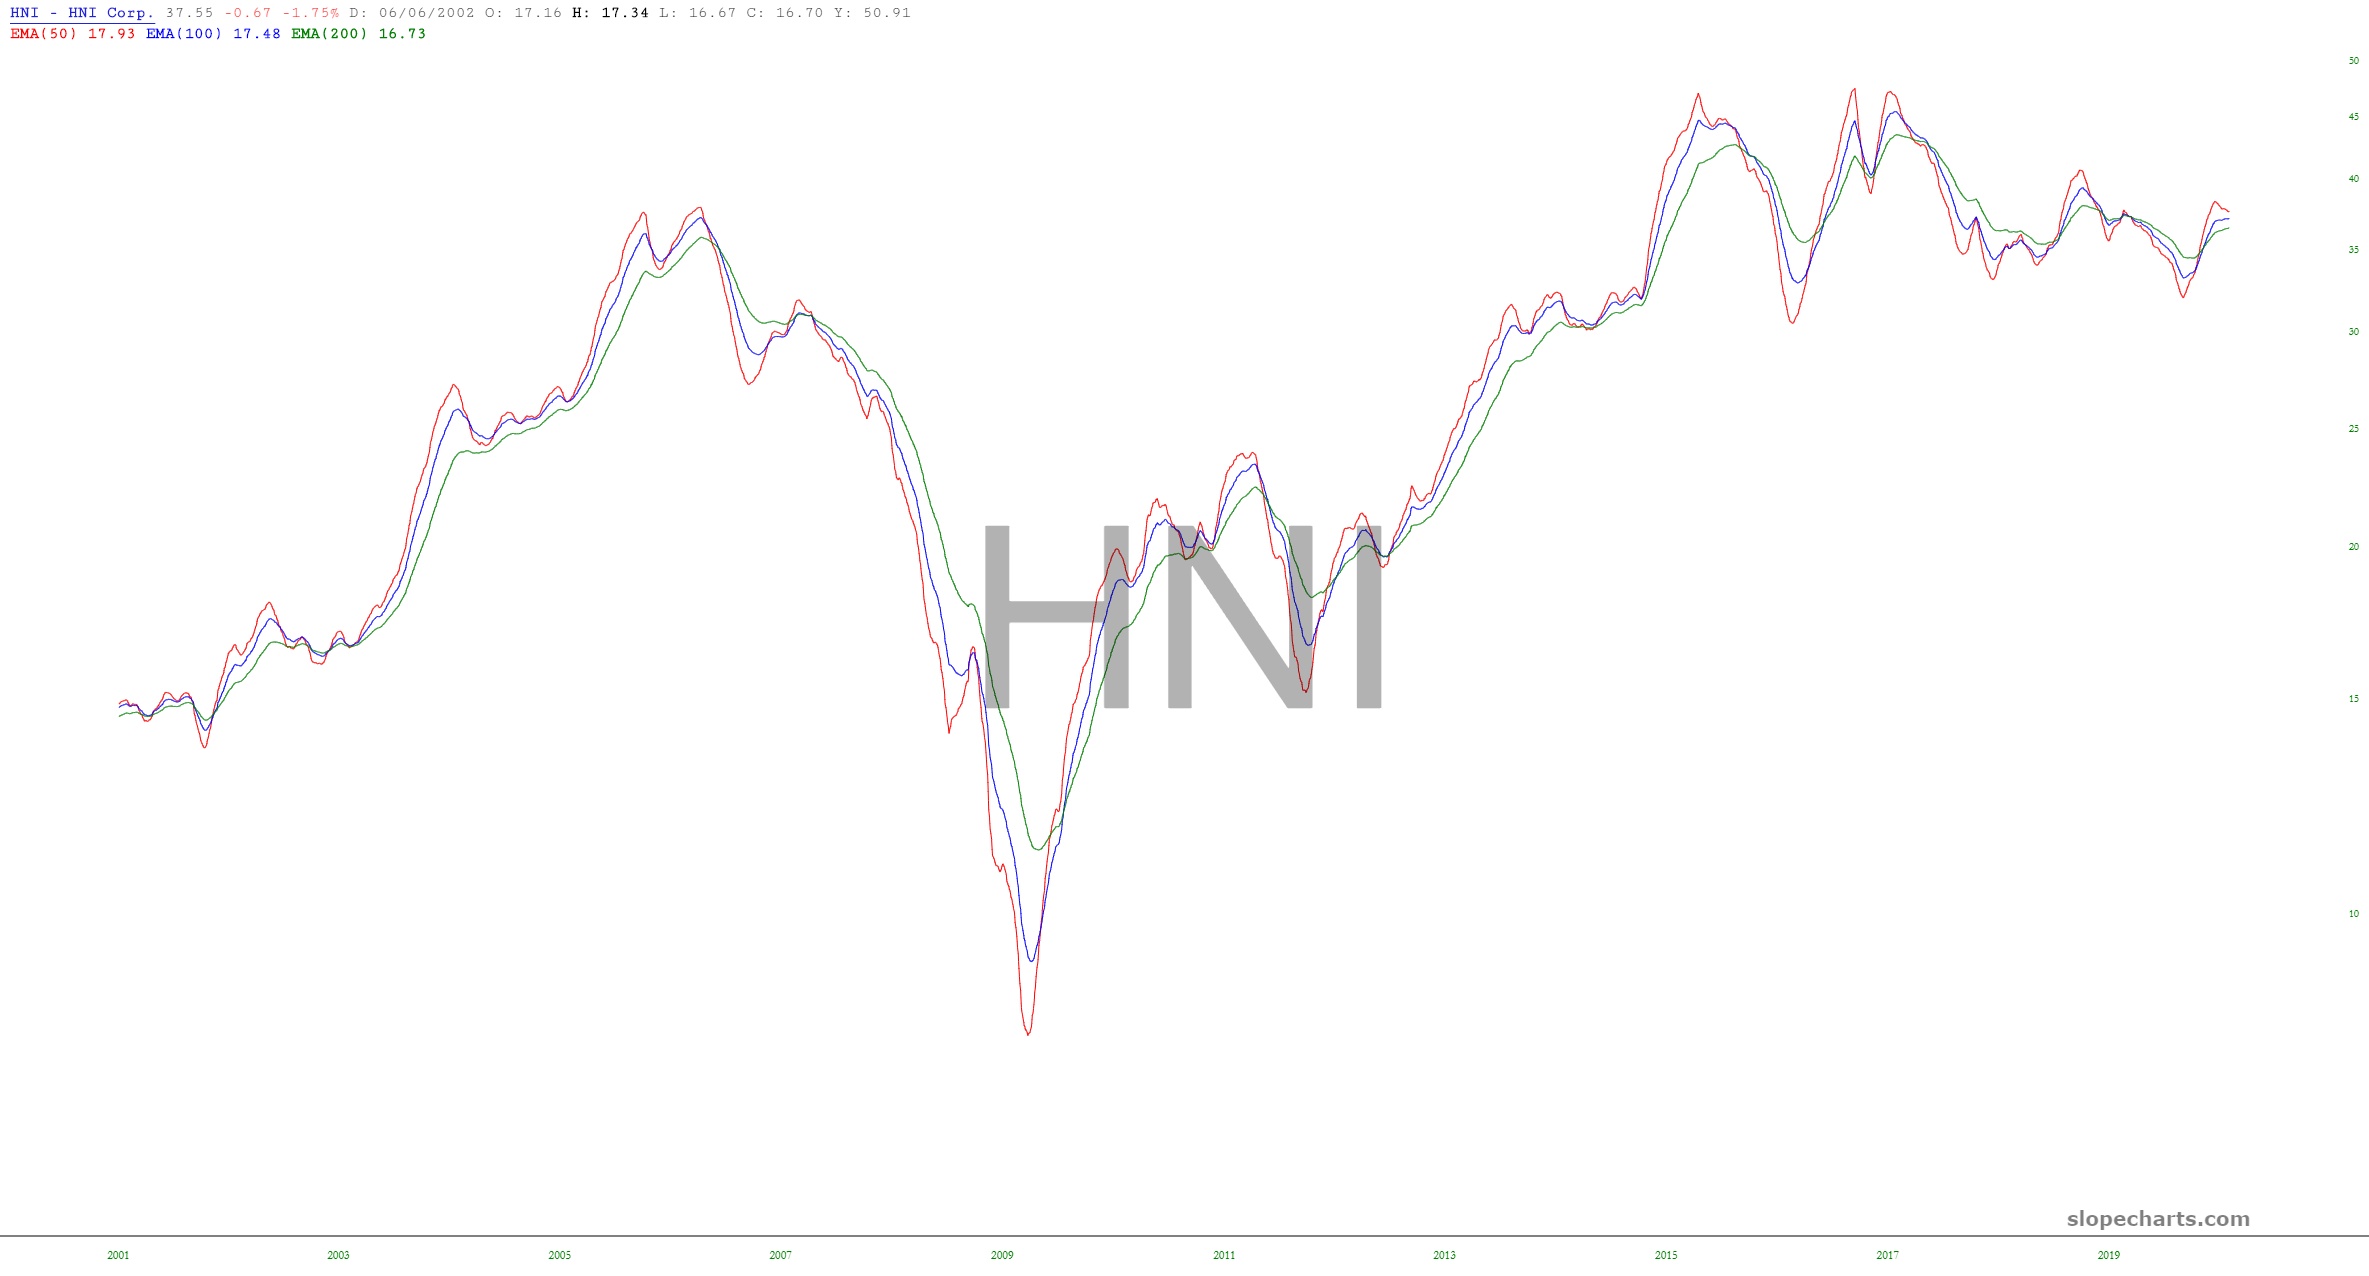
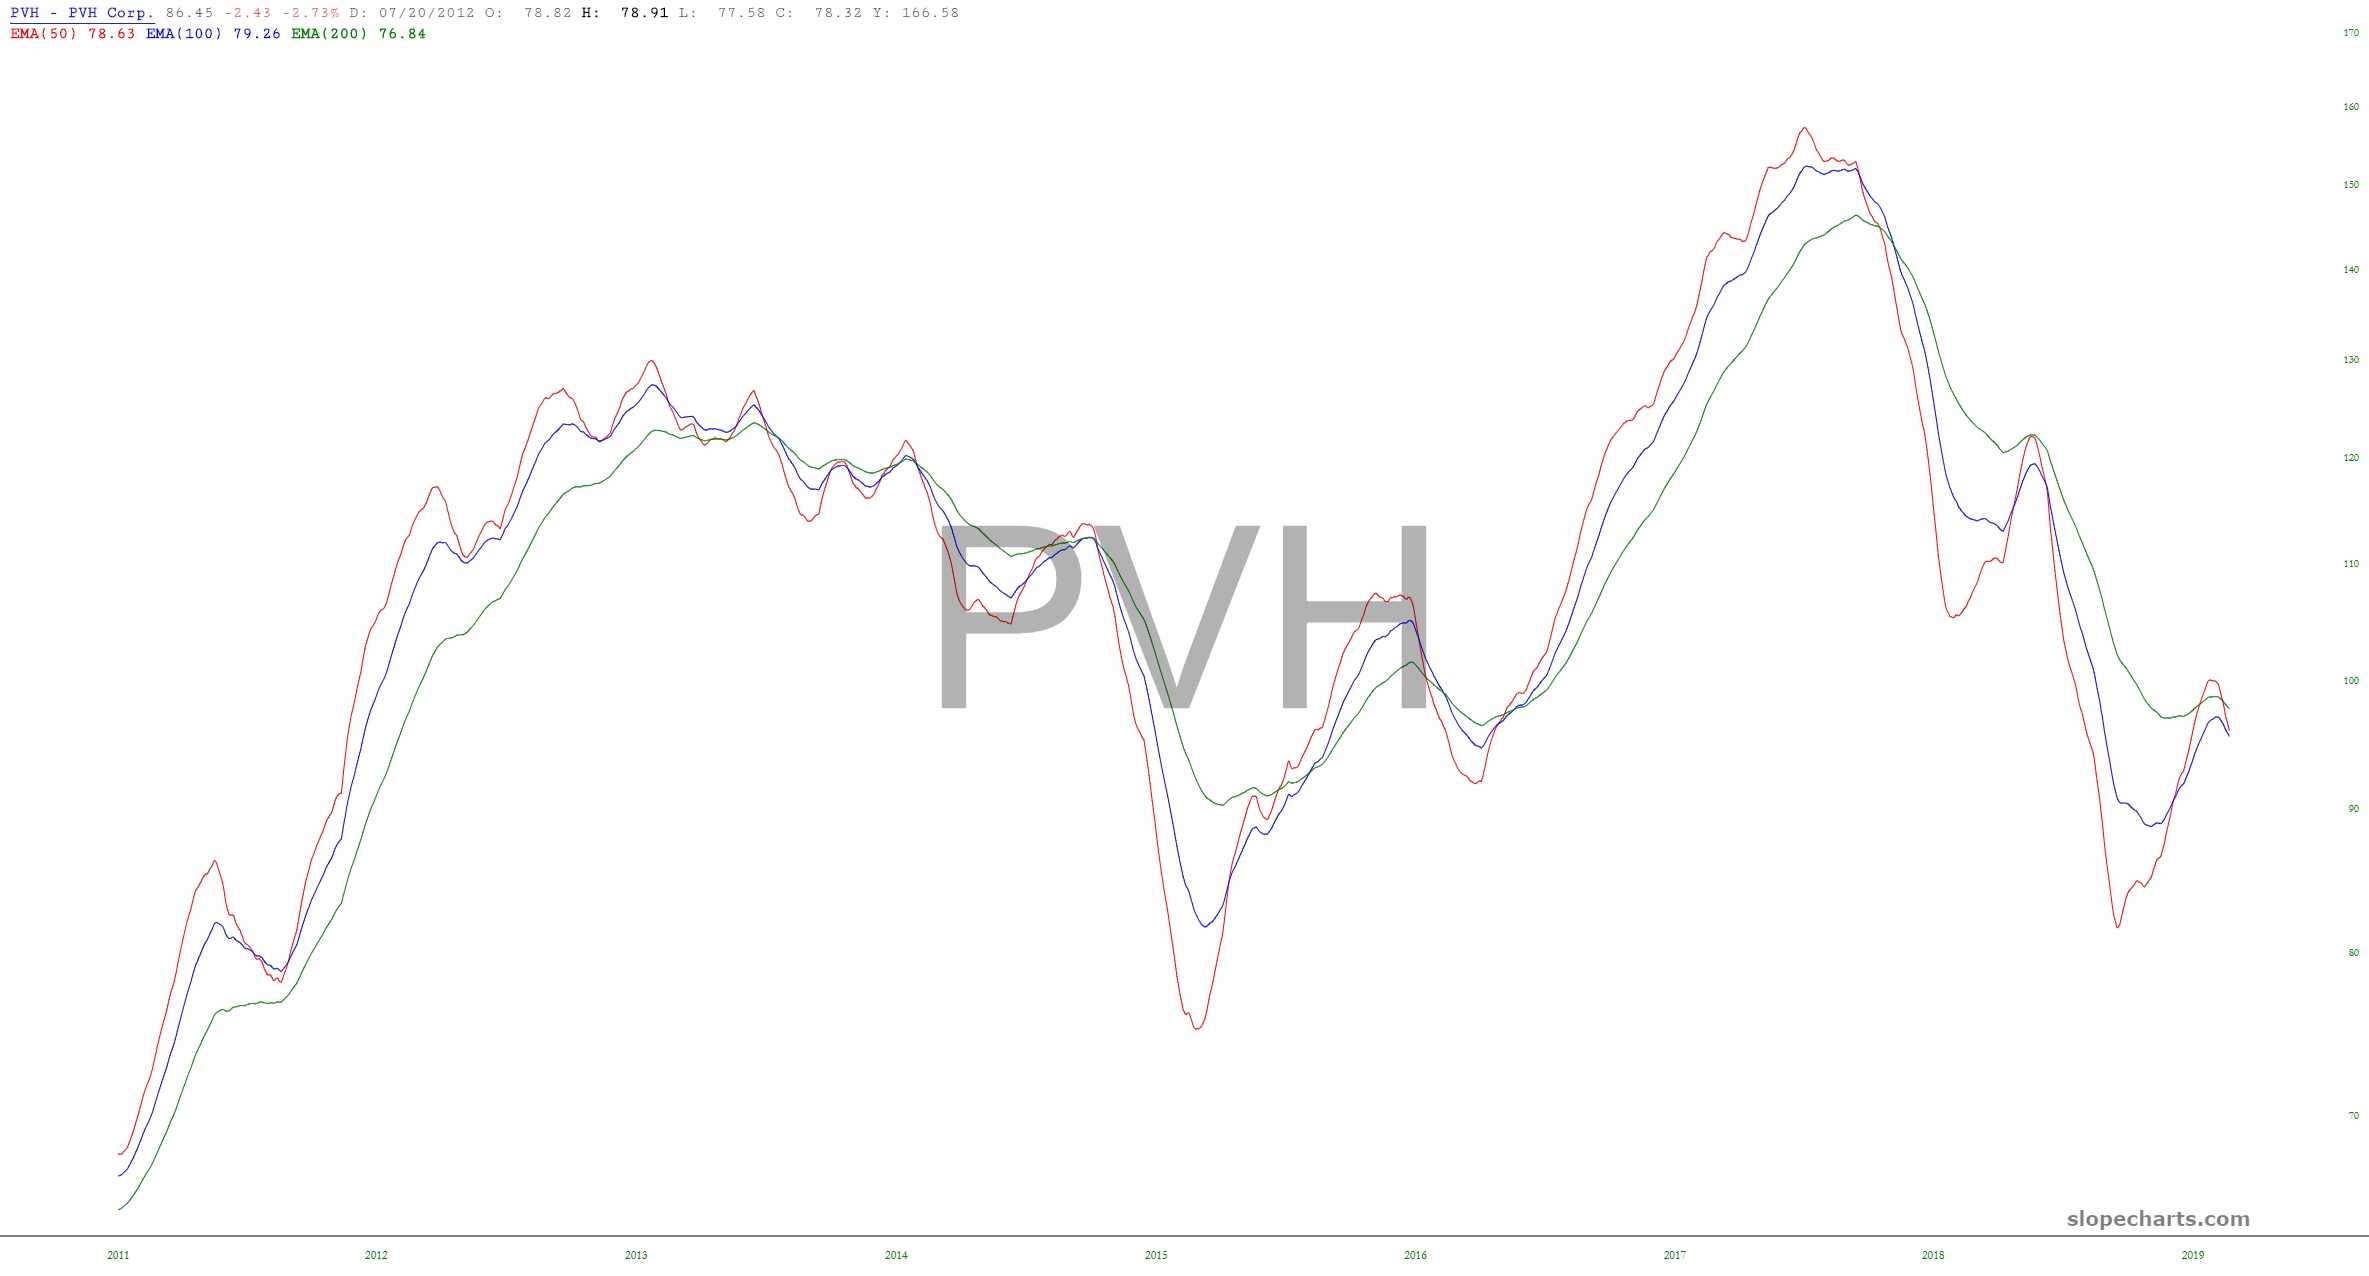
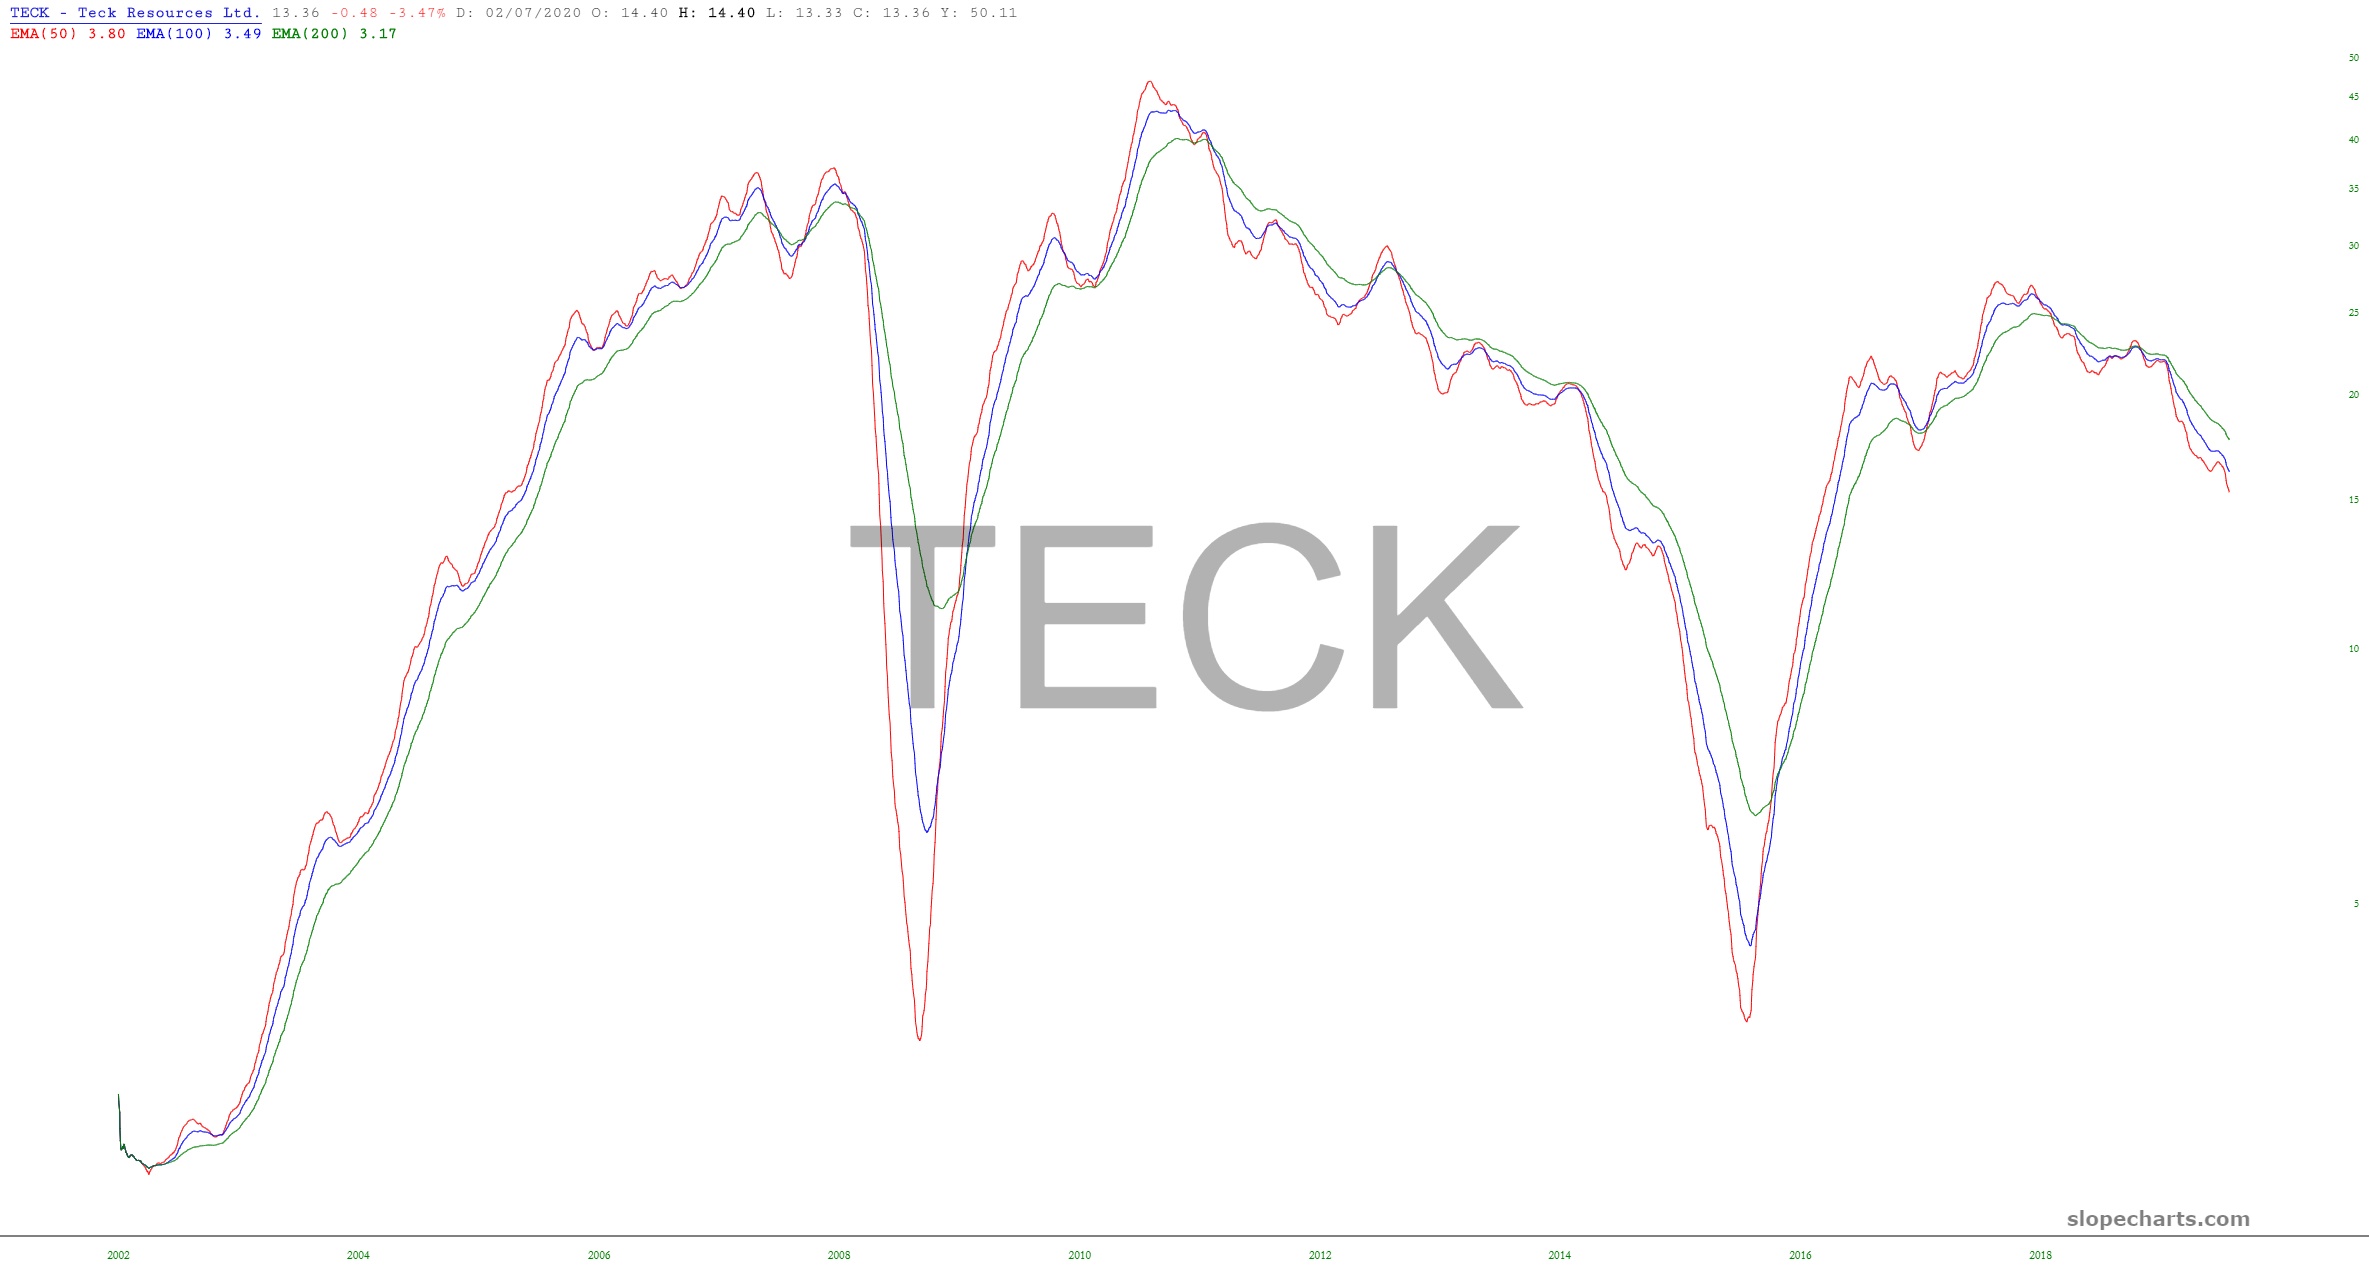
Here’s an unusual take on charts that I don’t think I’ve done before: I went through all 61 (yep, 61) of my short positions with exponential moving averages and the prices hidden, and I plucked out the ten whose configuration I found the most intriguing and exciting. So……..here they are (as always, click on any chart for an absolutely gargantuan view):

As a bonus chart, here is the ribbon study on the Dow Industrials-based “diamonds” ETF:

