
Any time I look at a long-term chart of economic data from the U.S., there seems to be an important inflection point at 1979. For example, wealth equality seemed to reach its peak then, but then it “V-bottomed” and has never looked back.
I thought of this recently when I was messing around in the economic database within SlopeCharts and looked at the debt-to-GDP ratio. Look at what was going on from about 1965 to 1979:
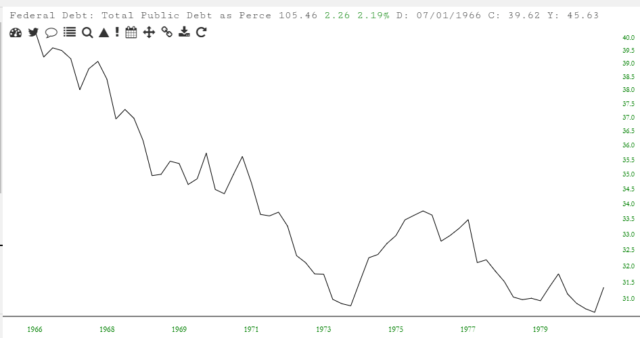
It may seem hard to believe, particularly with how lame the economy was in the 1970s, but the U.S. was making serious progress on its debt-to-GDP ratio. It fell from about 40% to about 30%. It seems poignantly amusing to consider that politicians actually pointed to the national debt as a problem back then. They had no idea – – none at all – – just how good they had it.
Afterward, though, it was off to the races. Reagan, of course, revolutionized deficit spending, and it simply never went out of style. Thus, we have gone from about 30% to over 100%.
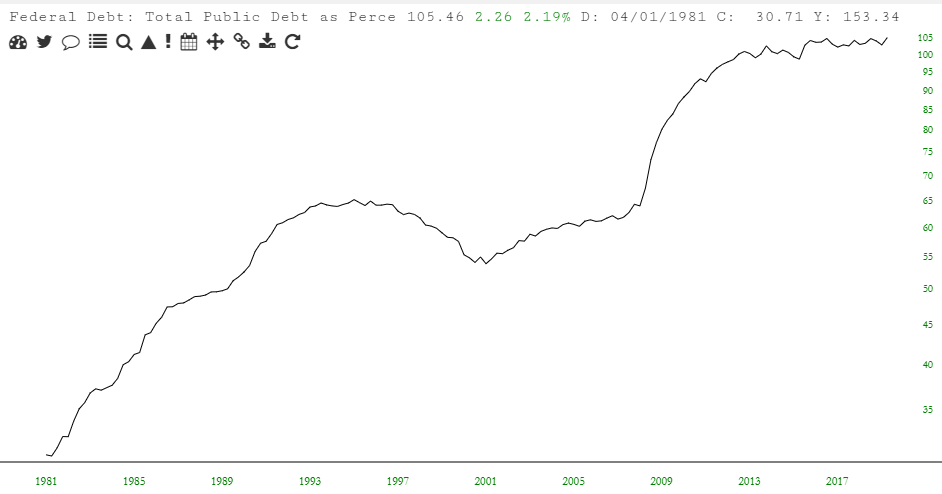
Even more chilling, this graph is going to simply keep blowing higher. And while politician in the 1970s actually seriously discussed a balanced budget amendment, and eliminating the debt altogether, such notions are an outright impossibility now. We are on a collision course with insolvency (or, more specifically, fiat worthlessness), and the bottle rocket that was lit in 1979 is simply going to keep heading skyward until it blows into countless pieces.
