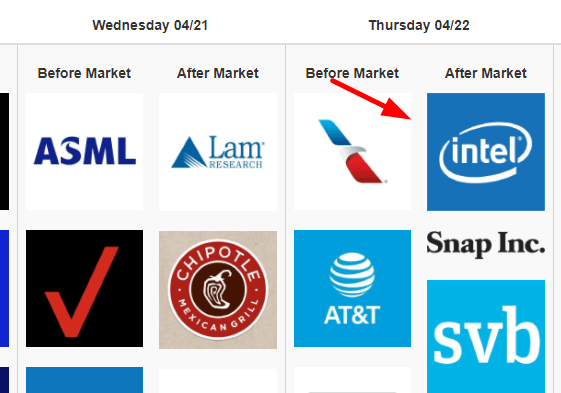
Since we’re in the thick of earnings season, I thought it would be an appropriate time to illustrate how much information is on Slope for any one company which is facing an earnings event. Referring to the Calendar of Earnings, I can see that Intel is at the top of the pops today, so we’ll focus on that one.
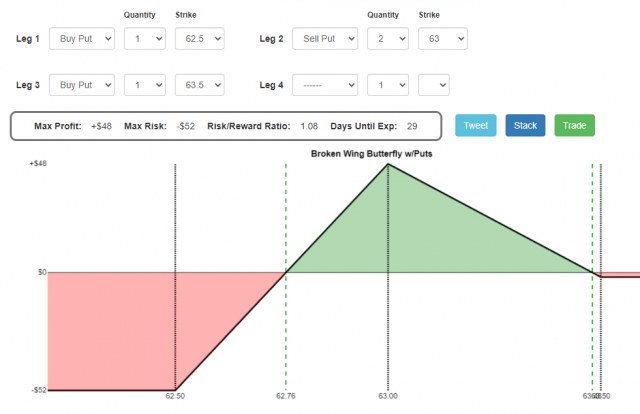
There’s the options payoff analyzer:
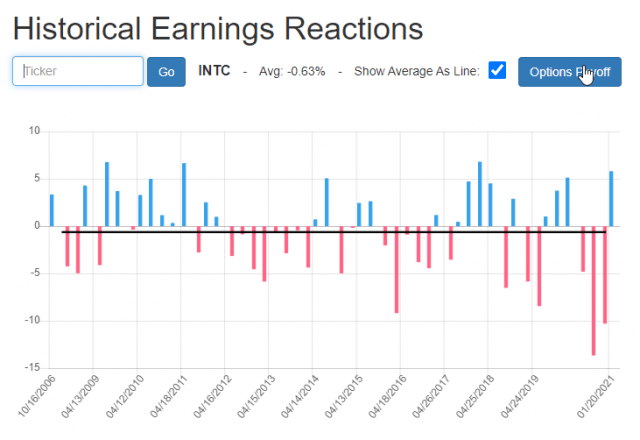
The history of earnings reactions:
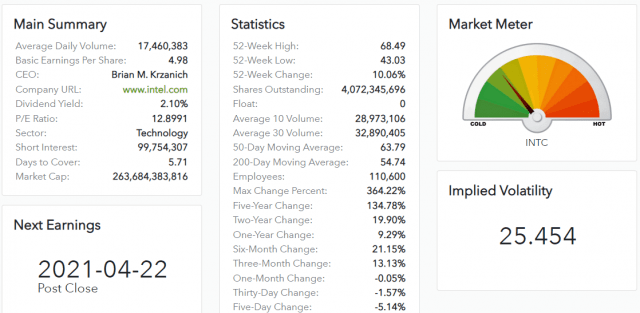
The Super Summary Page:
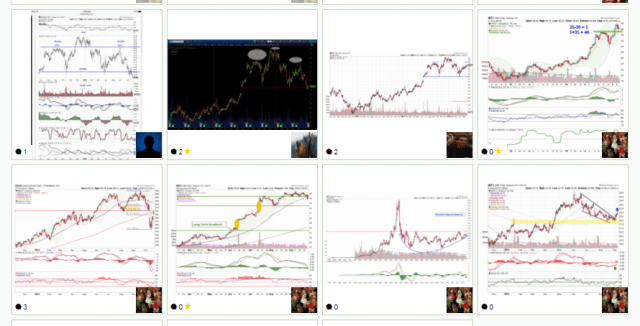
The stacks of INTC charts in SocialTrade:
The animated Market Meter:

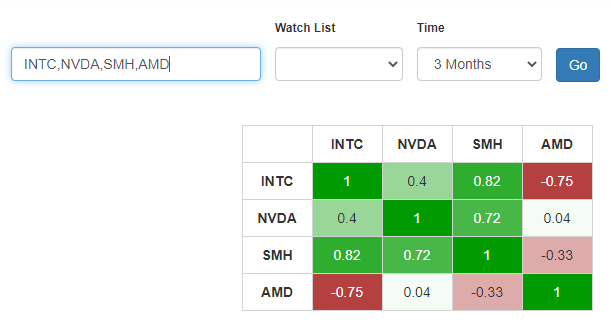
The correlation page:
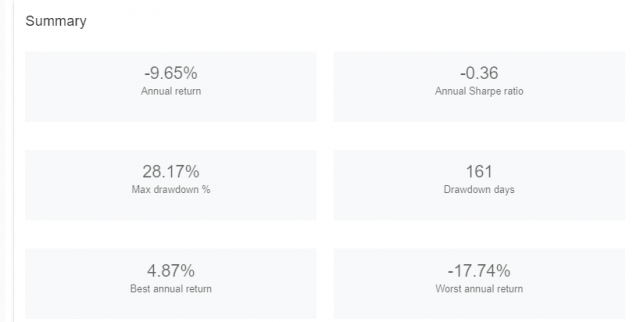
And the options strategy backtester:
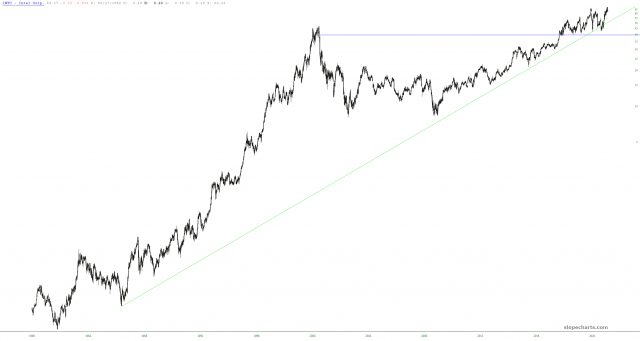
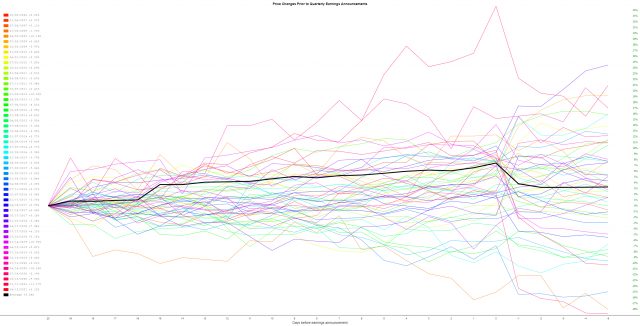
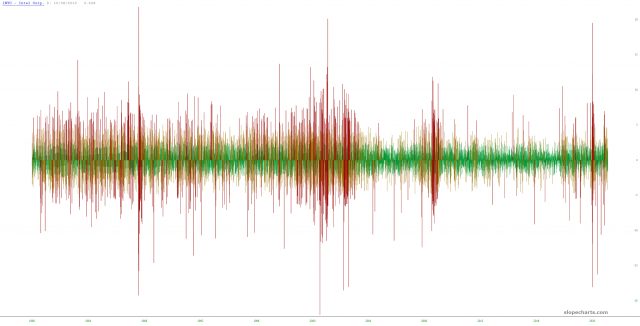
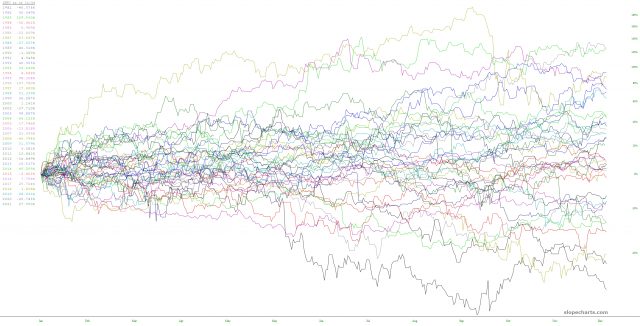
And, of course, in SlopeCharts, there is all manner of visualization you can create:
I bet I’ve even managed to overlook one or two things. The point is that there is a treasure chest of tools on Slope to do a deep dive into any given symbol.

