
Another quarter, another green bar. The stock “market” continues up, unabated, fueled by trillions of dollars in Powell Bux, plucked from thin air. Ever since the Fed took over the equity markets in early 2009, there have been just four meaningful red bars, each and every one of them met with more trillions of dollars of welfare for billionaires.

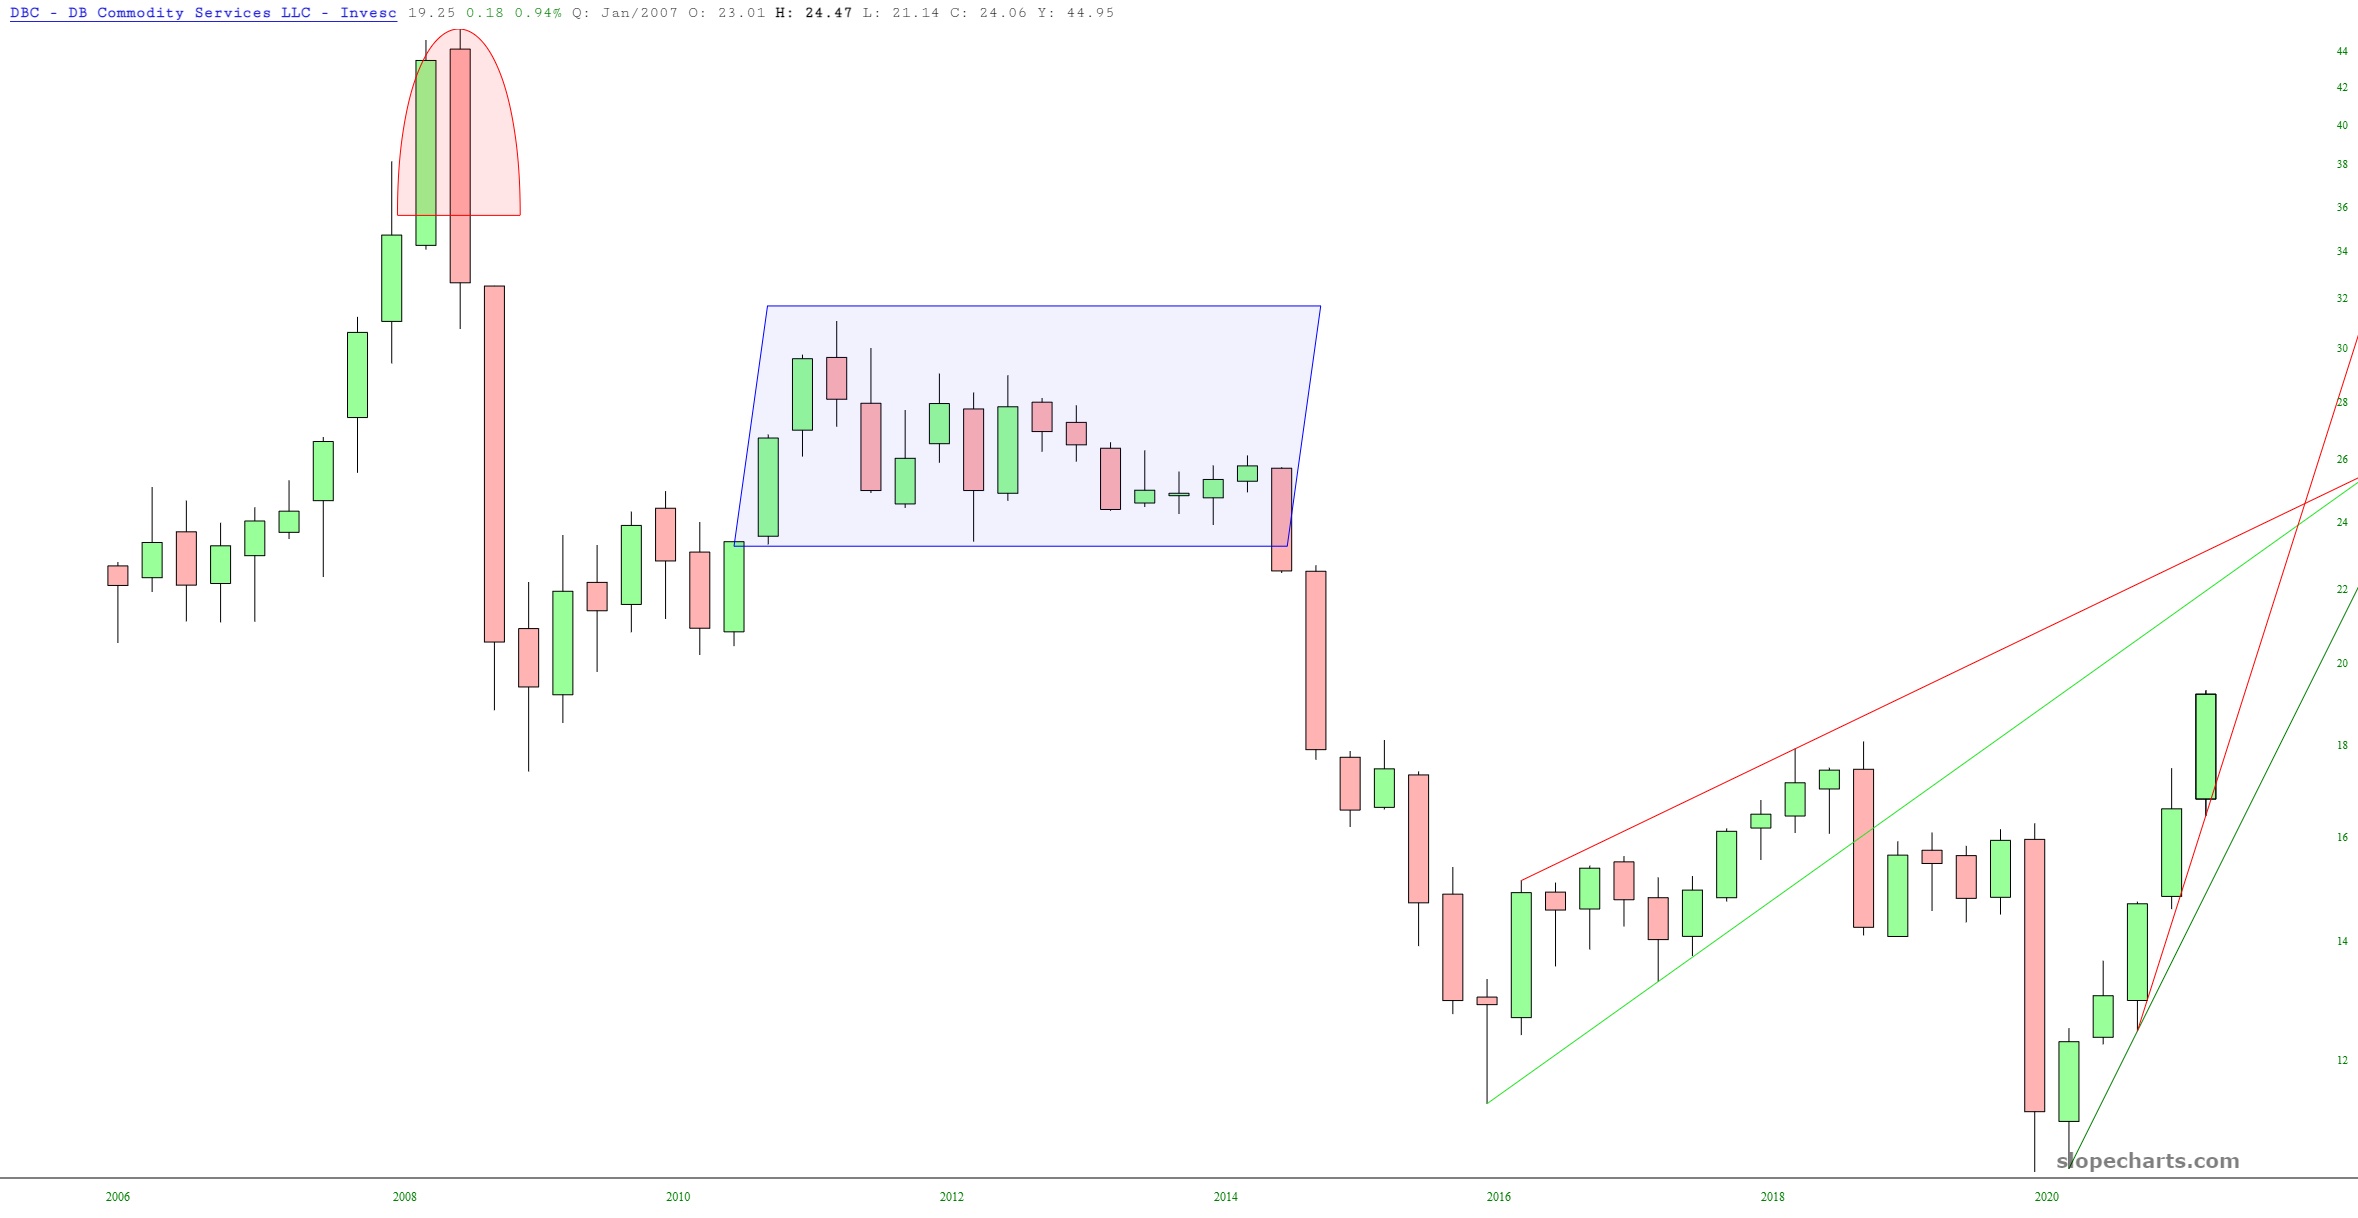
Here we see commodities in particular have exploded higher (in case it’s not screamingly obvious yet, I am using Quarterly bars in SlopeCharts, instead of the usual daily bars). In spite of everything – – including housing – – exploding in price, the Fed continues to pretend that inflation is well under their mindless goal of 2%, so they keep pumping out the trillions. The ruling class could not be more delighted. They’ve never had it so good!
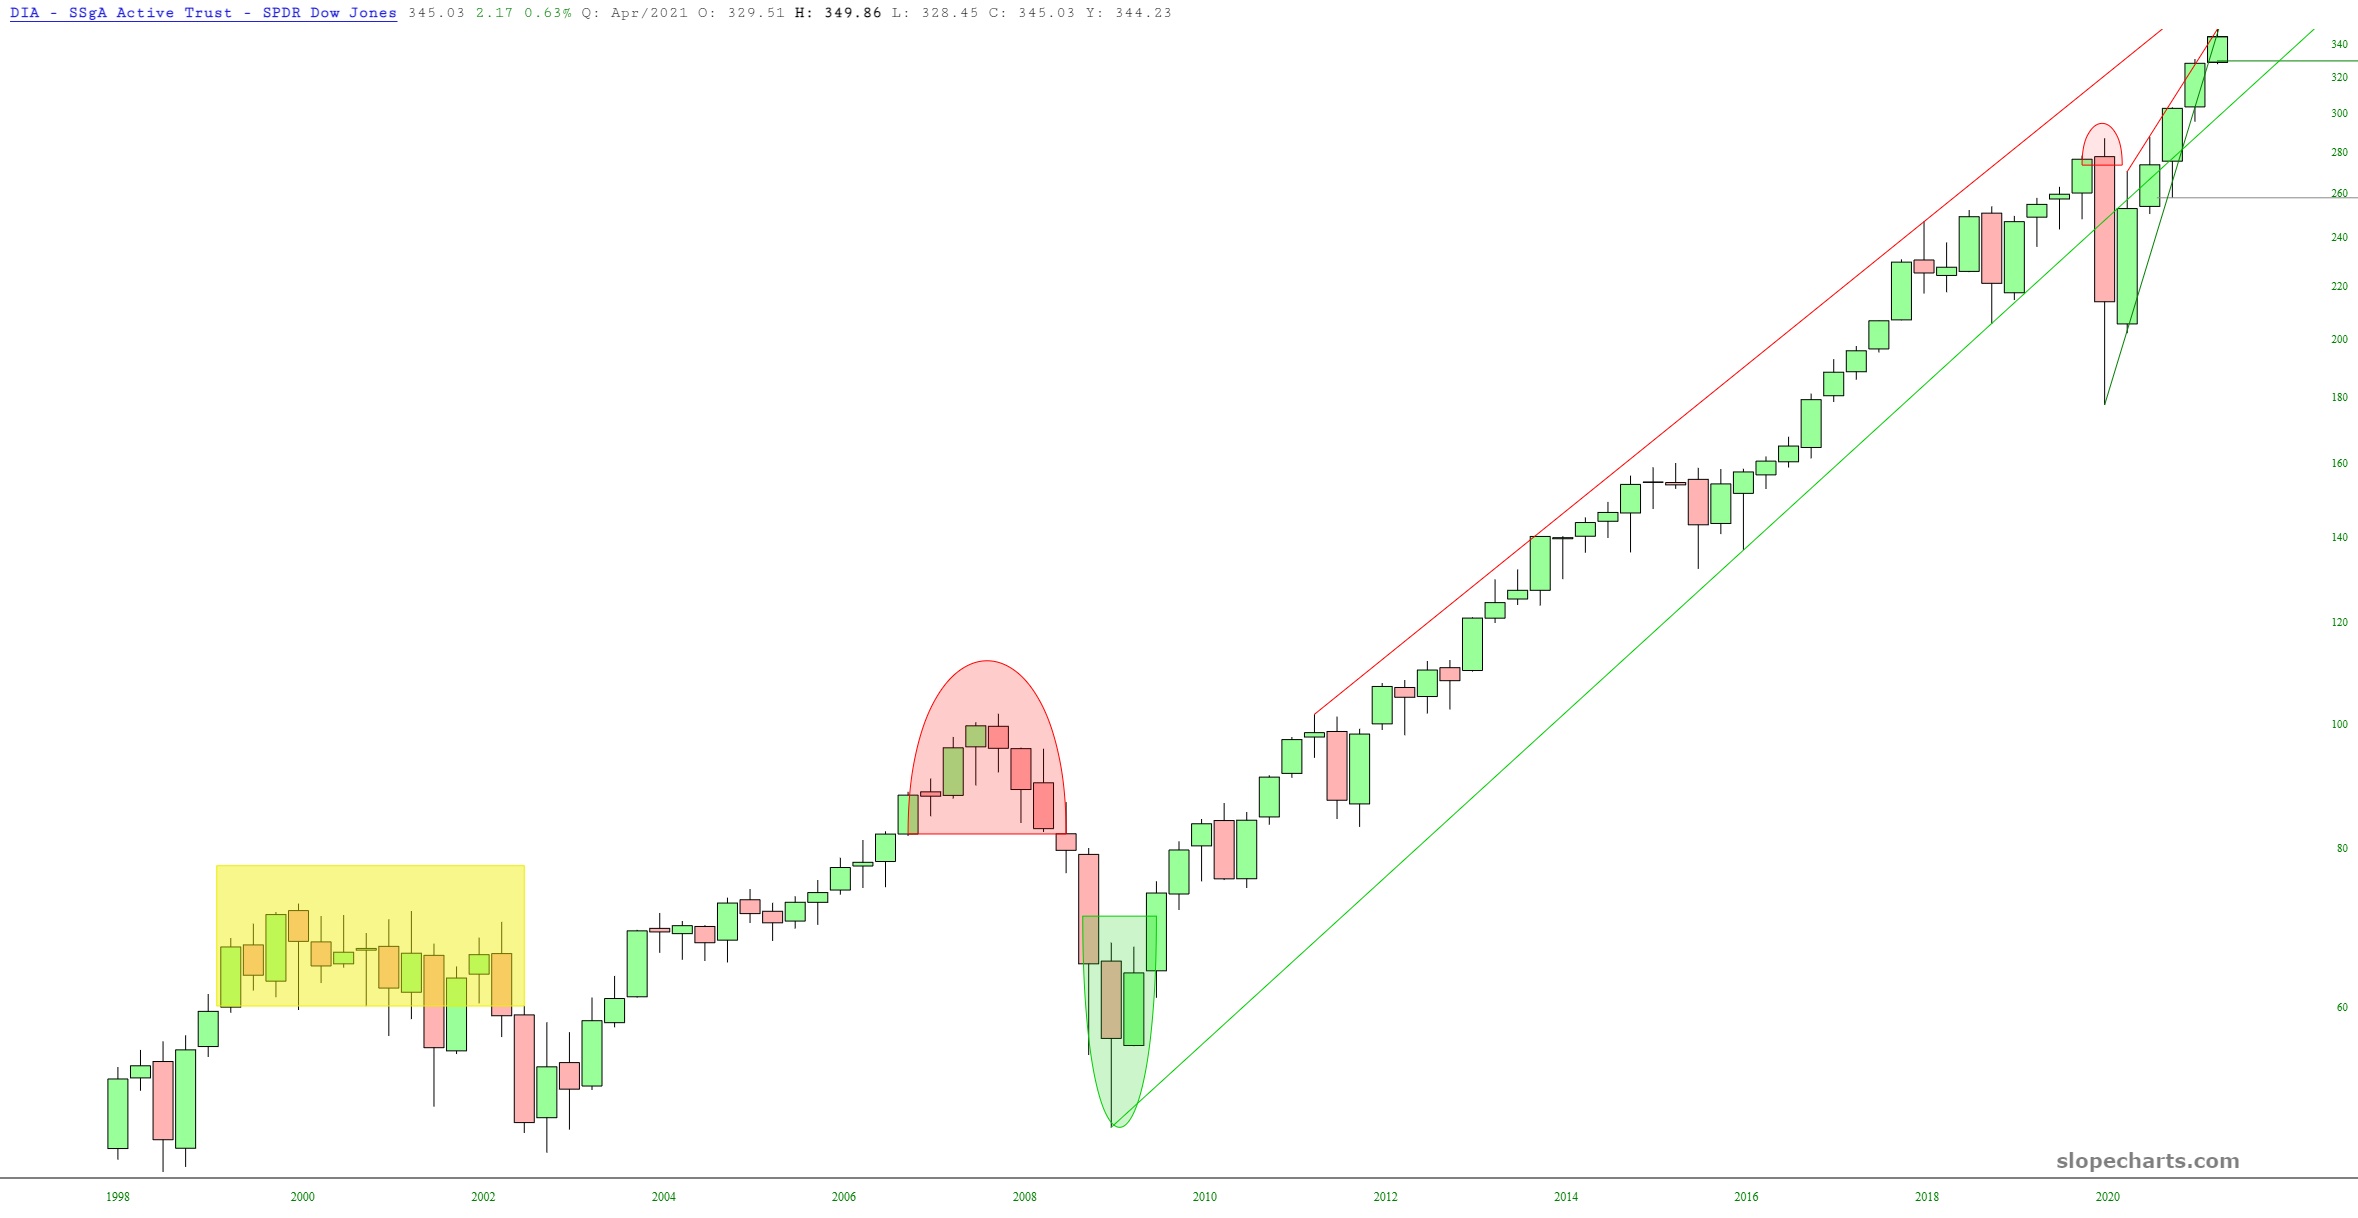
Here is the entire history of the Dow 30 “diamonds” (DIA) which, back in the day, would have boom-and-bust cycles, but ever since 2009, you can put a butter knife on your computer screen and conceal every single price bar. Even the Covid Crash was just a brief three-week hiccup. Stocks have never been more expensive. Not even close.
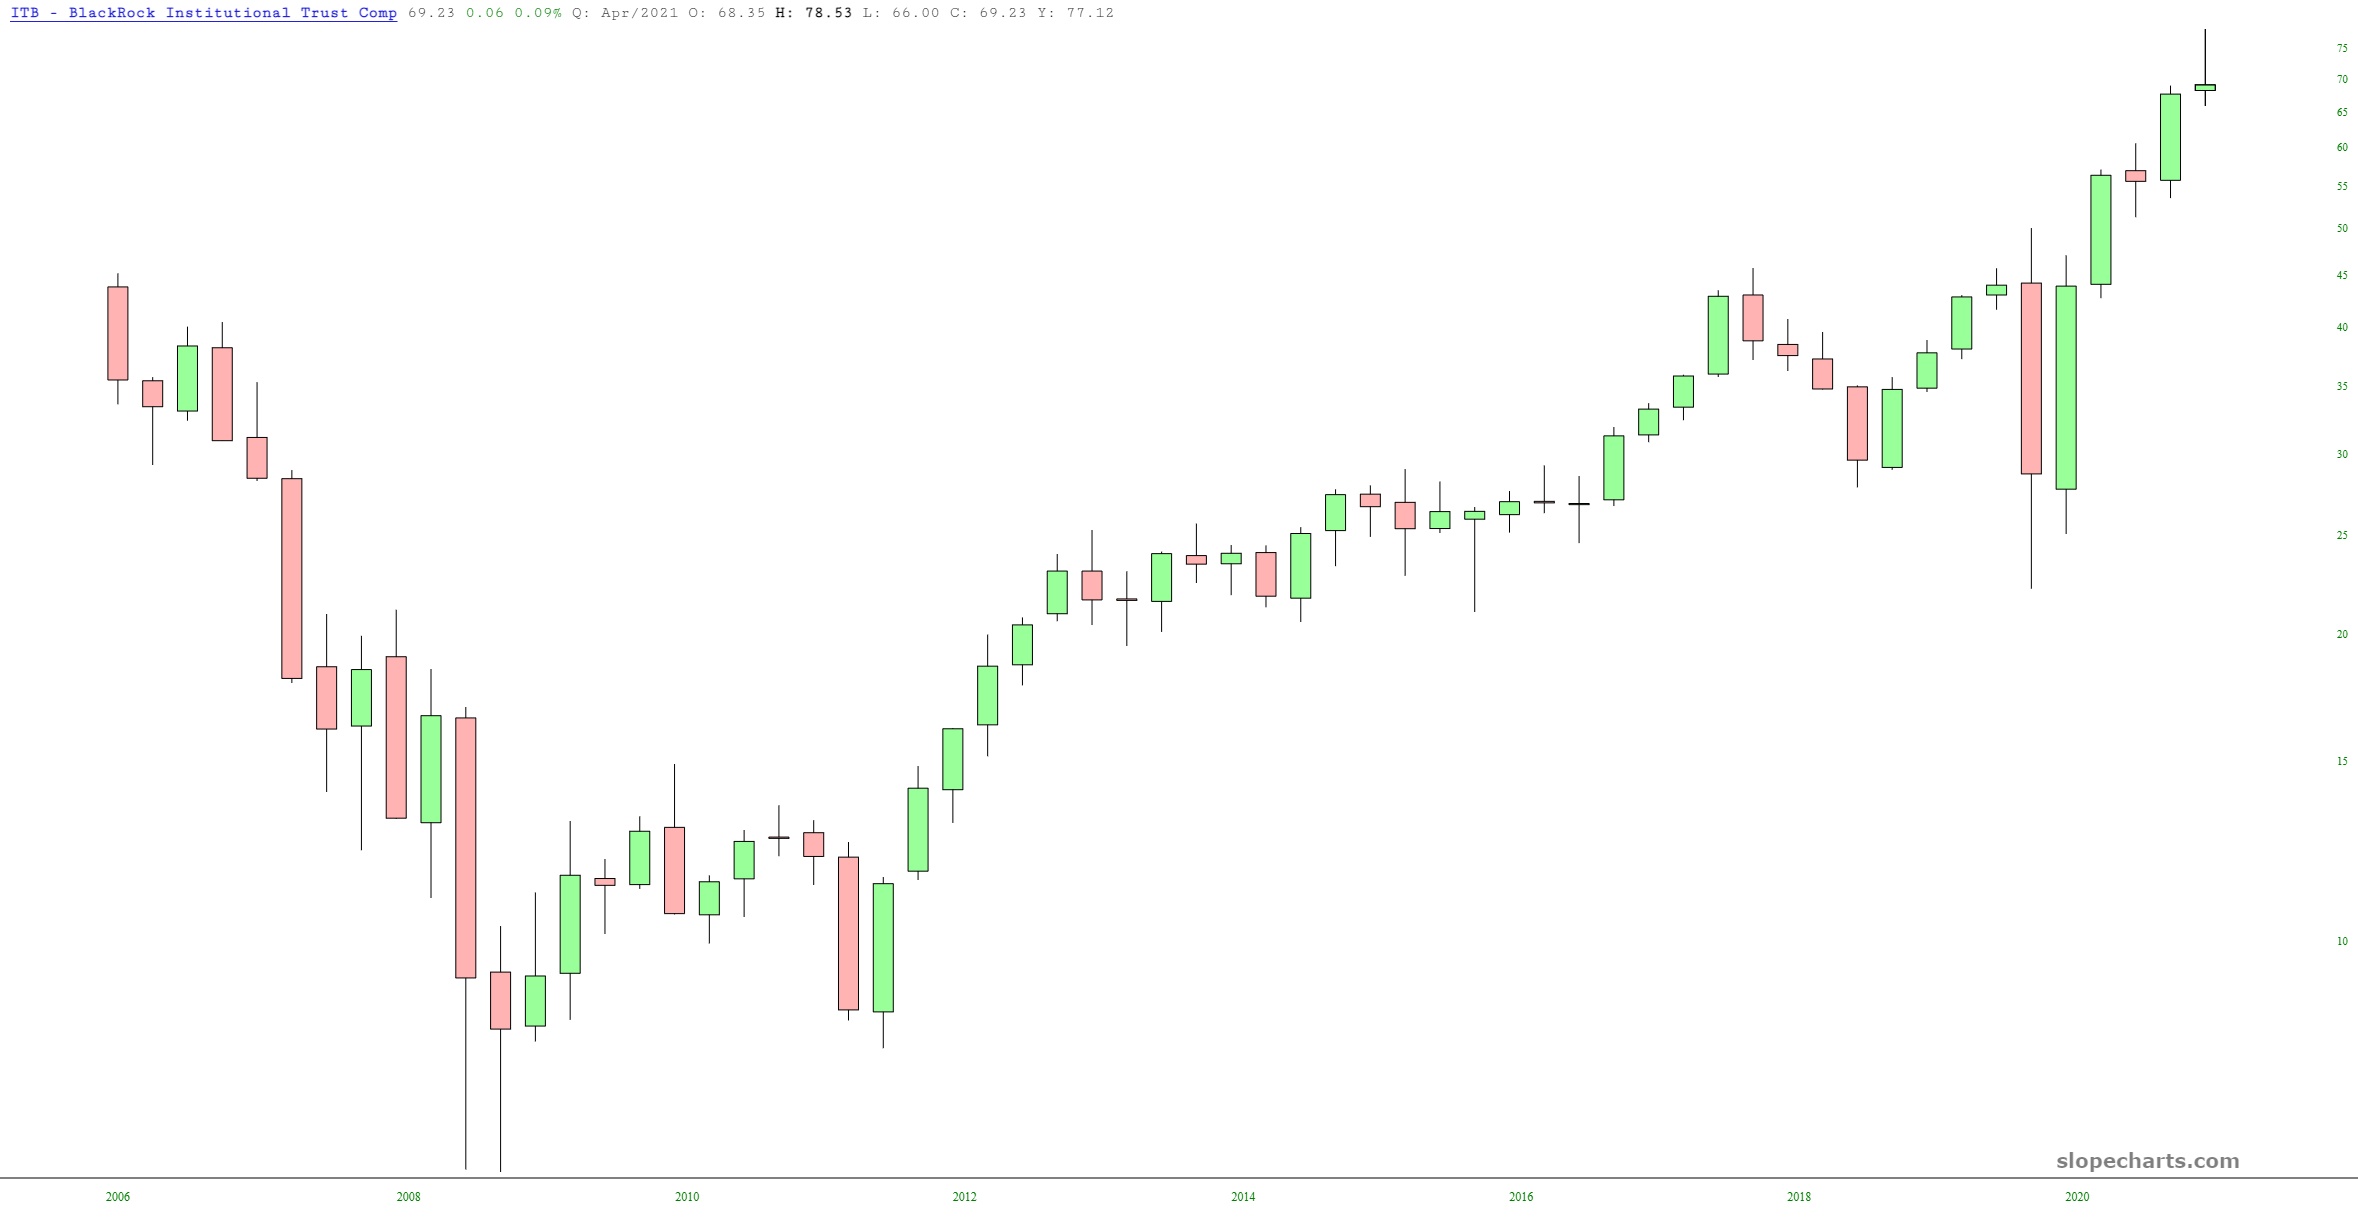
Things are looking not-so-certain in the world of housing. The ITB, an important homebuilder fund, is sporting a very well-defined shooting star reversal pattern. I emphasize, in case there are any slower Slopers, these are quarterly charts.
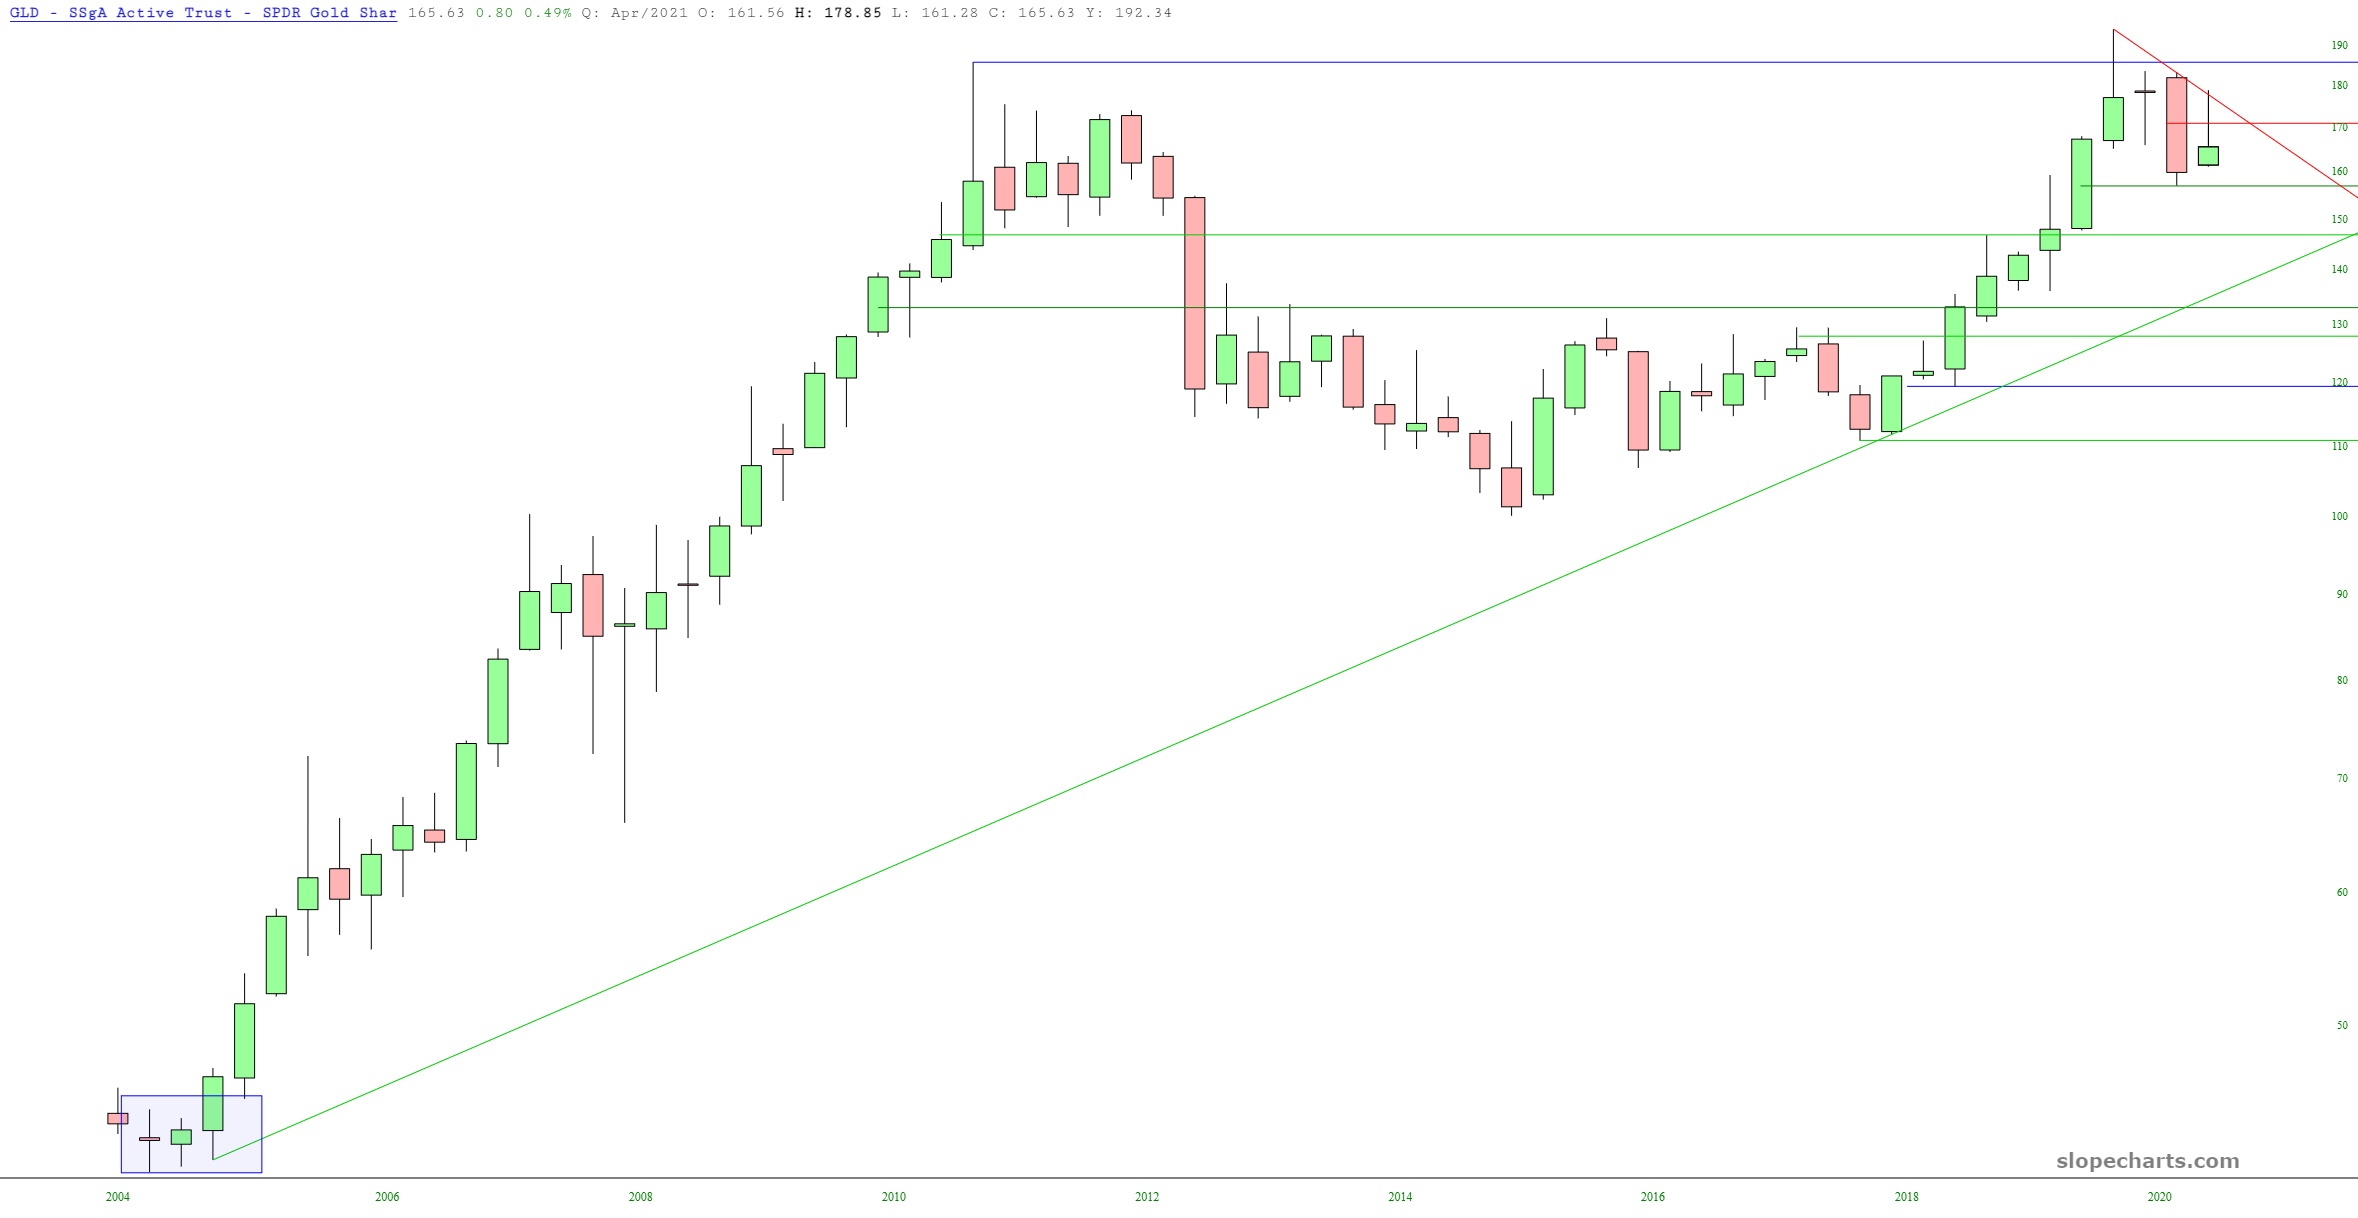
Gold, of course – – to borrow a phrase from Charlie Munger – – didn’t do dick-squat. Ironically, with all this inflation raging around us, the one and only asset not “inflating” is precious metals, which has been the classic inflation hedge ever since Jesus strolled across the Jordan.
That’s five charts so far. I’ve got five others, but I’m going to show those just to Slope’s beloved paying members, since they keep the lights on here. If you’ve benefited from Slope so far this year, consider signing up and joining us! So here we go………
