It’s a good thing we common folk have Cathie Wood to give us professional guidance.

Slope initially began as a blog, so this is where most of the website’s content resides. Here we have tens of thousands of posts dating back over a decade. These are listed in reverse chronological order. Click on any category icon below to see posts tagged with that particular subject, or click on a word in the category cloud on the right side of the screen for more specific choices.
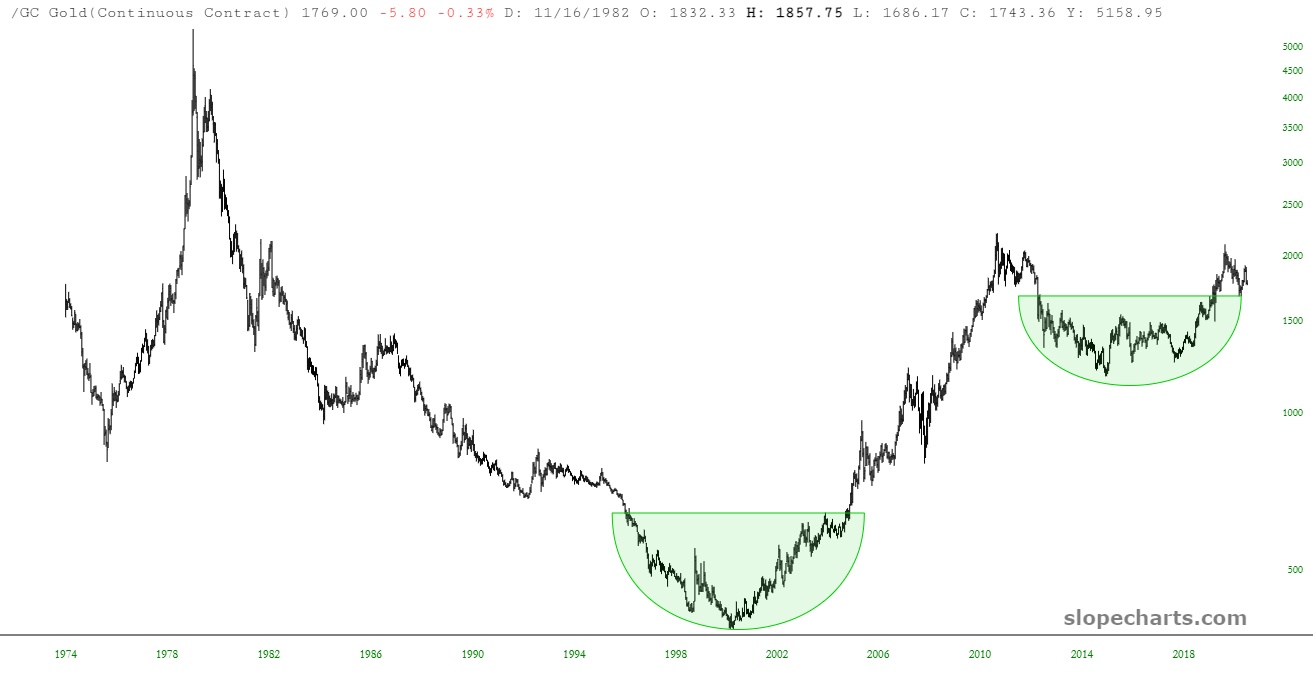
I spent part of my Father’s Day doing my favorite thing in the world: dorking around with historical price data and playing around with charts. I have put together three quick posts, inspired by the new futures database we have here on Slope. It’s just a simple chart with a simple conclusion in the caption:
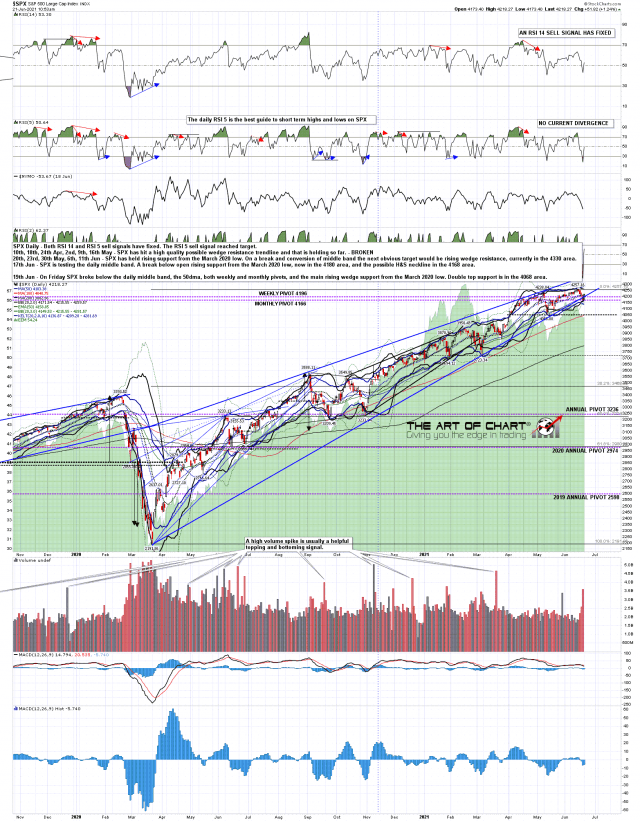
Friday was very weak, particularly for a big opex Friday, and SPX broke down through the daily middle band, currently 4215 area, the 50dma, currently 4183 area, and on ES even briefly broke down below the monthly pivot. We are seeing a rally this morning and I was giving the ideal rally high area on my premarket video at theartofchart.net in the 4230-5 SPX area. The odds look good for a reversal there into lower lows.
SPX daily chart: