
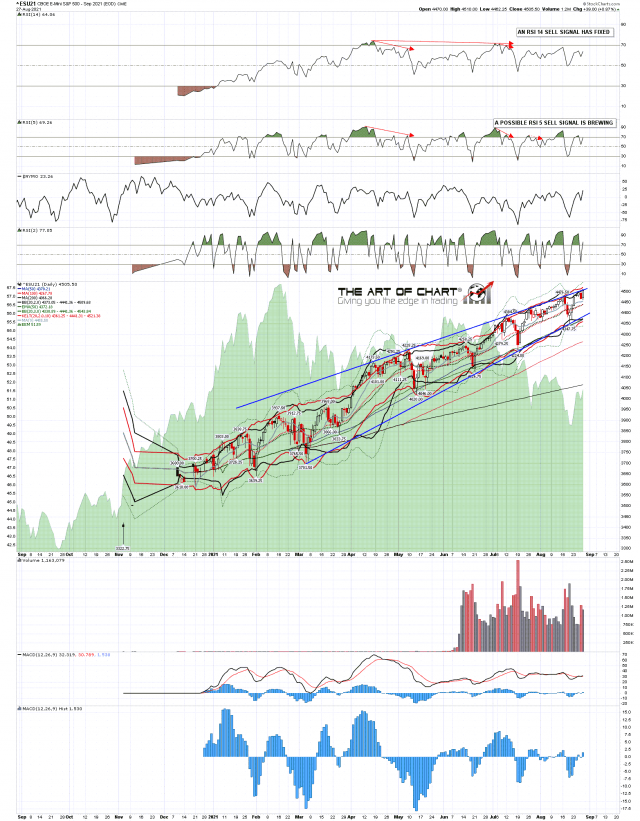
I’ve been looking at the resistance trendlines on ES and SPX over my last few posts, and the scenario I was looking at in my post on Friday 6th August that we may be seeing the start of a retracement here that could deliver a 3800 area retest. I was saying that we might well see more highs before that main move started and we’ve seen that.
One resistance trendline that I wasn’t looking at was the rising wedge resistance trendline that has developed over recent weeks and ES is testing that too. Possible daily RSI 5 sell signals are now brewing on ES, SPX and NDX.
ES Sep daily chart:
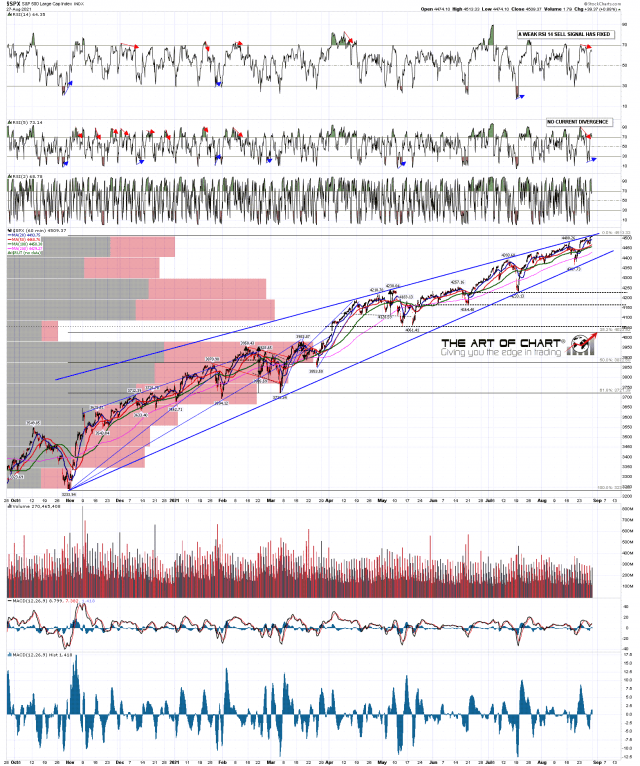
On the hourly chart SPX is testing rising wedge resistance from the March 2020 low ……….
SPX 60min 20Mo chart:
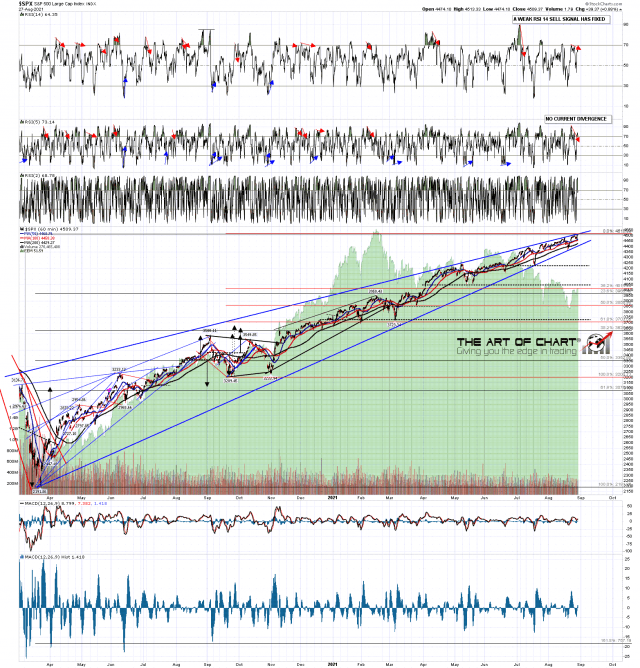
………. and the wedge resistance trendline from the November low, which is part of the larger wedge resistance trendline.
SPX 60min 10Mo chart:
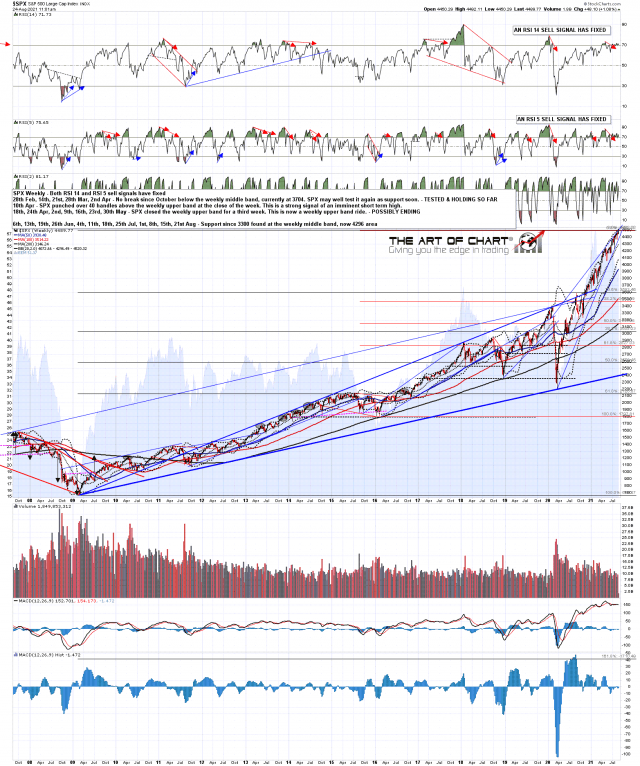
Weekly RSI 14 and RSI 5 sell signals have already fixed on SPX.
SPX weekly chart:
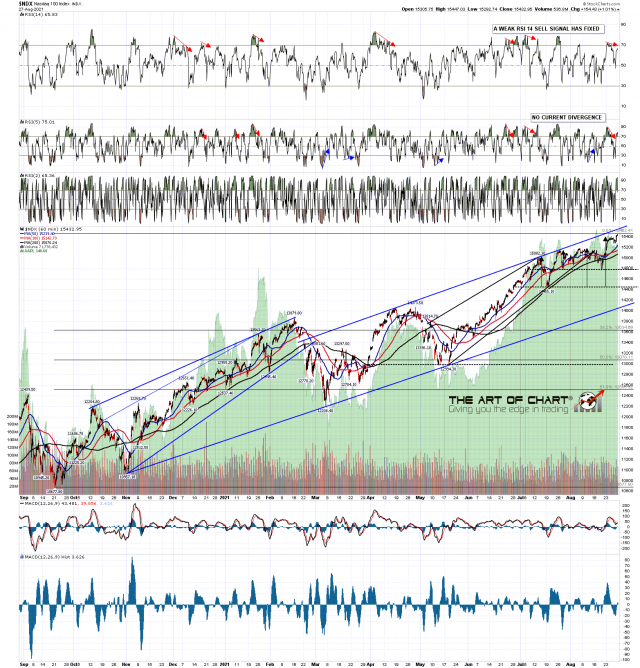
The NDX resistance trendline hadn’t quite been touched when I captured this chart at the weekend but has had a perfect test shortly after the open this morning.
NDX 60min chart:
So there we have it. Resistance trendlines hit, High quality negative divergence. Everything needed for a high except, so far, the actual turn. Hard to overstate the importance of that of course. We’ll see now if we get that, but the setup is certainly looking good.
The free public webinar scheduled for last Thursday had to be delayed a week and is now scheduled for an hour after the close on Thursday 2nd September at theartofchart.net and will looking at the usual six big tech stocks and eleven sector ETFs, many of which are looking particularly interesting here. If you’d like to attend you can register for that here, or on our August Free Webinars page.
