SPX and NDX held the strong resistance they were testing a week ago, retraced a bit, and are now close to testing them again. I have been expecting new all time highs on both, and NDX has made a new all time high today, but SPX is still a bit short and likely needs to make a new one too.
Both RSI 14 and RSI 5 daily sell signals are now fixed on SPX, and if resistance holds again, then next short term high at least is close.
SPX daily chart:
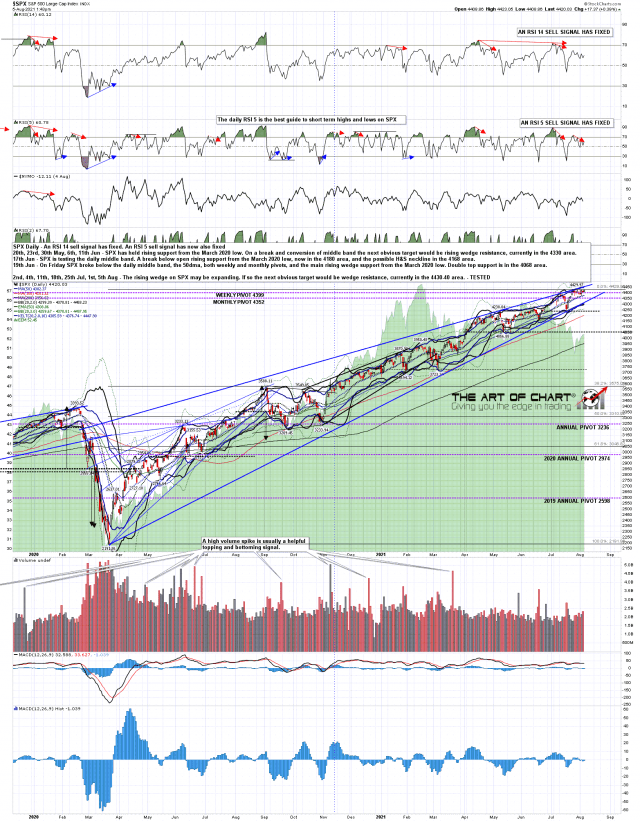
The wedge resistance trendline on SPX is currently in the 4445 – 50 area, so that is approximately in the 4435 – 40 area on ES. That doesn’t need to be hit that we should at least see that new all time high before a turn.
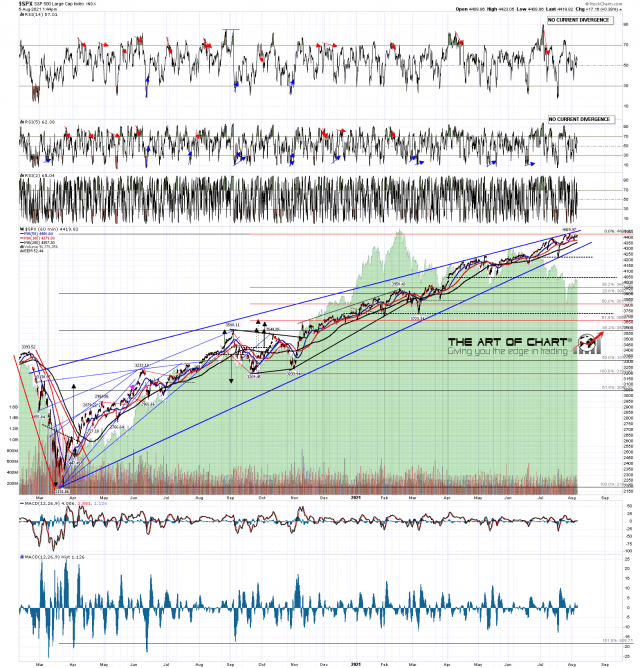
SPX 60min chart:
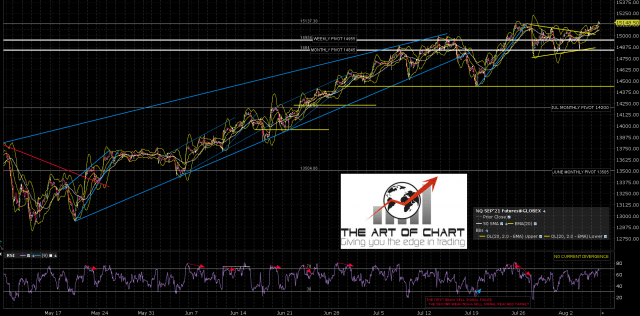
NQ formed a really nice little bullish triangle from the last all time high and that delivered a textbook break up, backtest into the triangle, and move to the (minimum) target at a retest of the all time high. That is a minimum target and NQ/NDX could go a bit higher still.
NQ Sep 60min chart: