
Writing for me is kind of like a dam bursting. The lake fills up, fills up, and then all at once there is an earthquake in me that causes the dam to break and all the water comes rushing out. Of late, I have been getting requests to write more from all sides of my life. I will say that due to some positive life changes coming down the pike, I will be having much more free time beginning next year. I have many thoughts at the moment on how to use that time, but would be interested in your feedback. At the moment I am considering either a weekly Youtube broadcast to discuss my trading and methodology, or a weekly hour long meeting for traders to gather together live on a platform such as Discord. If you have any interest in either of those, I would be interested to hear your comments below.
Alright, on to the main course. Today I am going to be examining my three areas of specialty: SPX, oil, and gold. I believe each have the potential to be at key turning points. Let’s take a look as to why, and what we can expect going forward from each.
Gold
Let’s start with gold. Its been unloved this year, so let Rev step up and show the shiny metal some love. I believe we are in the early stages of a long term bull market in gold, as well as commodities. Looking at the chart below, I believe we saw the first impulse of that bull market from 2018-2020. From August of 2018 to August of 2020 /GC made the large move higher from 1167 to 2089. Heading into this year I was working off the assumption that this would be a consolidation year for gold, and have largely stayed away from the space this year. I think that is about to change.
One important item to note about the precious metals market is that it trades differently than SPX. The broader market tends to make spike, panic lows, and rounded tops. Gold tends to make spike tops and rounded bottoms. You can see the rounded bottom around the 2018 low, and the spike top in August of last year. In hindsight, I think the past seven months will also be seen as another rounded bottom.
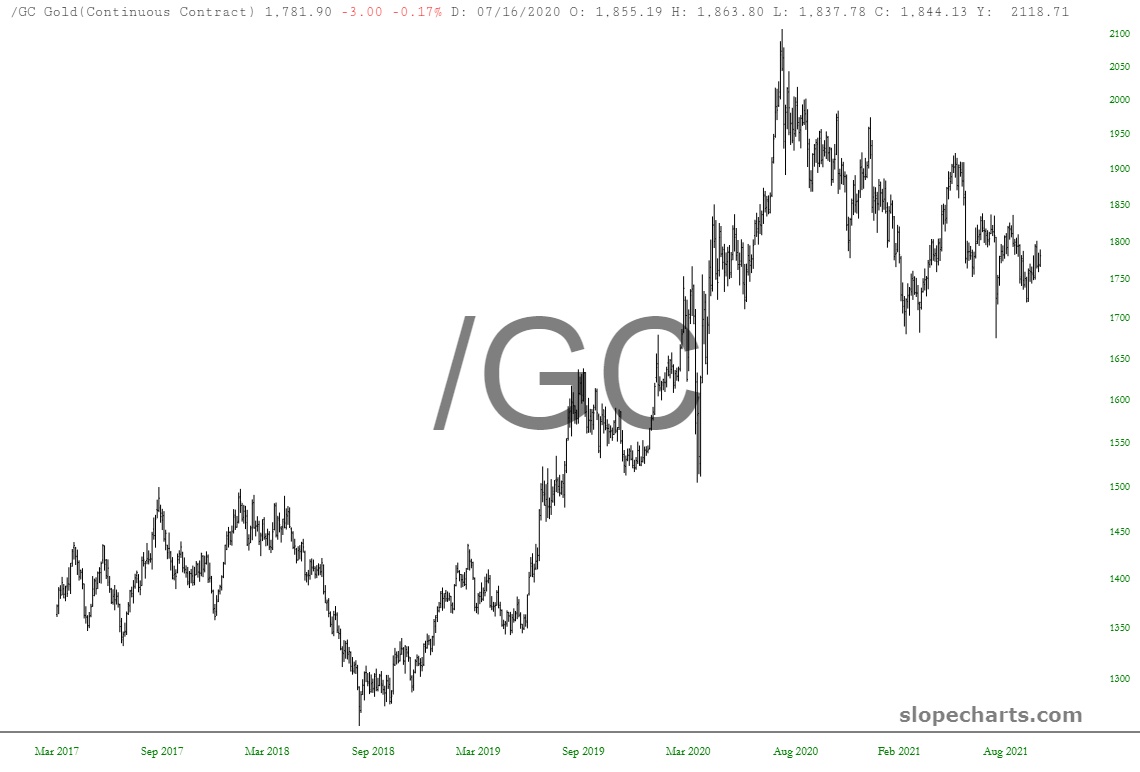
The correction we have seen in gold over the past year has been roughly at 38% retracement of the 2018-2020 move. Not the end of the world, just a healthy consolidation. So where do we go from here? I will give you my short term and long term thoughts.
For the short term, I think there is a bullish opportunity in gold heading into next spring. Gold tends to operate on a 13.5 month cycle. You can read an old article from Tom McClellan explaining it here. A “mid-cycle low” should be somewhere around here, and then we should be looking at the possibility of a bullish move in gold heading into next spring.
As I will discuss below, I think there is a large possibility of a selloff in the broader market over the course of the next month. If we do see a broader market selloff, the possibility exists for GDX to selloff in sympathy. That may or may not happen, but I’ll choose to wait for that risk to pass by. Thus, my current plan is to get back involved in the gold/silver miners after a broader market selloff, and look to hold them into next spring.
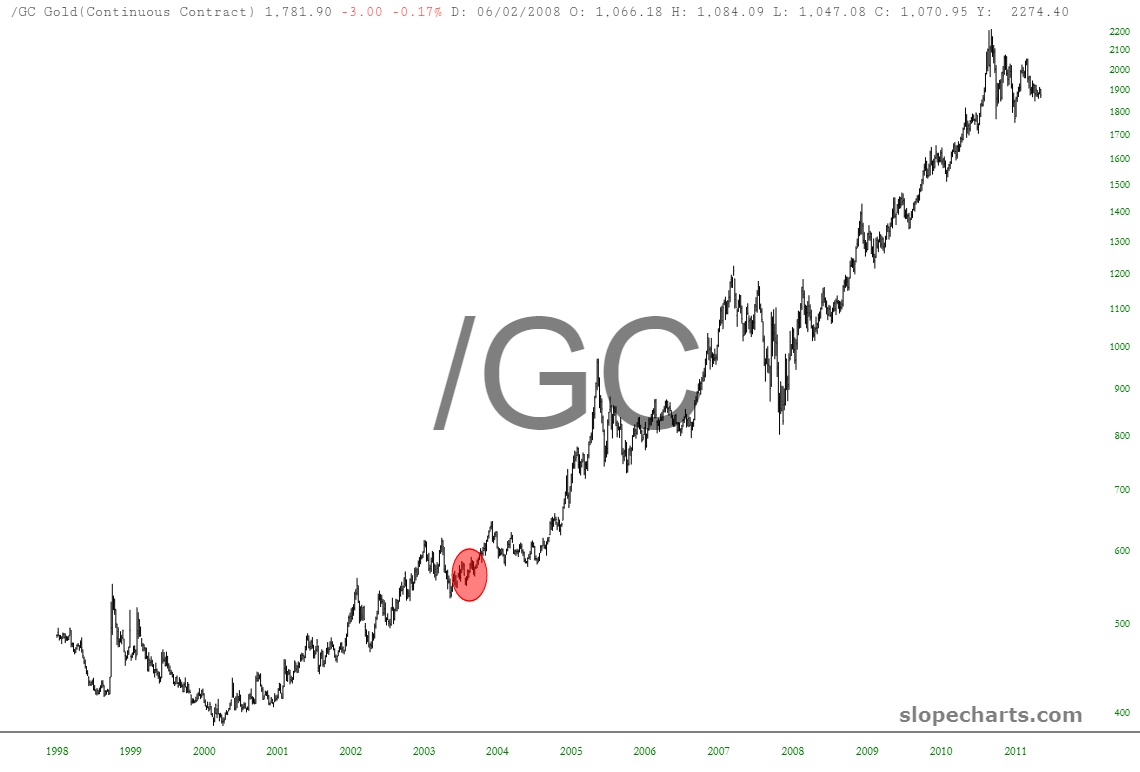
Longer term, I remain extremely bullish on the metals. I have been operating under the assumption that we are living through the beginning stages of a commodities bull market similar to what we saw at the turn of the century. If we consider the 2001-2011 bull market in gold as a possible analog (which I do), I have circled below where I believe we likely are at now. If that analog continues to ring true, the next three years should see some very nice gains in the metals complex. Jesse Felder also penned a similar article this week, titled “Why the Gold Miners Could Soon Make FANG Look Tame, Part Deux”.
Oil
Oil has been the center-piece of my trading this year. After having ridden a portfolio of oil companies and pipeline MLPs higher this year, I took profits and moved back to cash over the course of the first two weeks of October. Let’s take a look as to why I did that, and what I expect in the oil market over the course of the next six months.
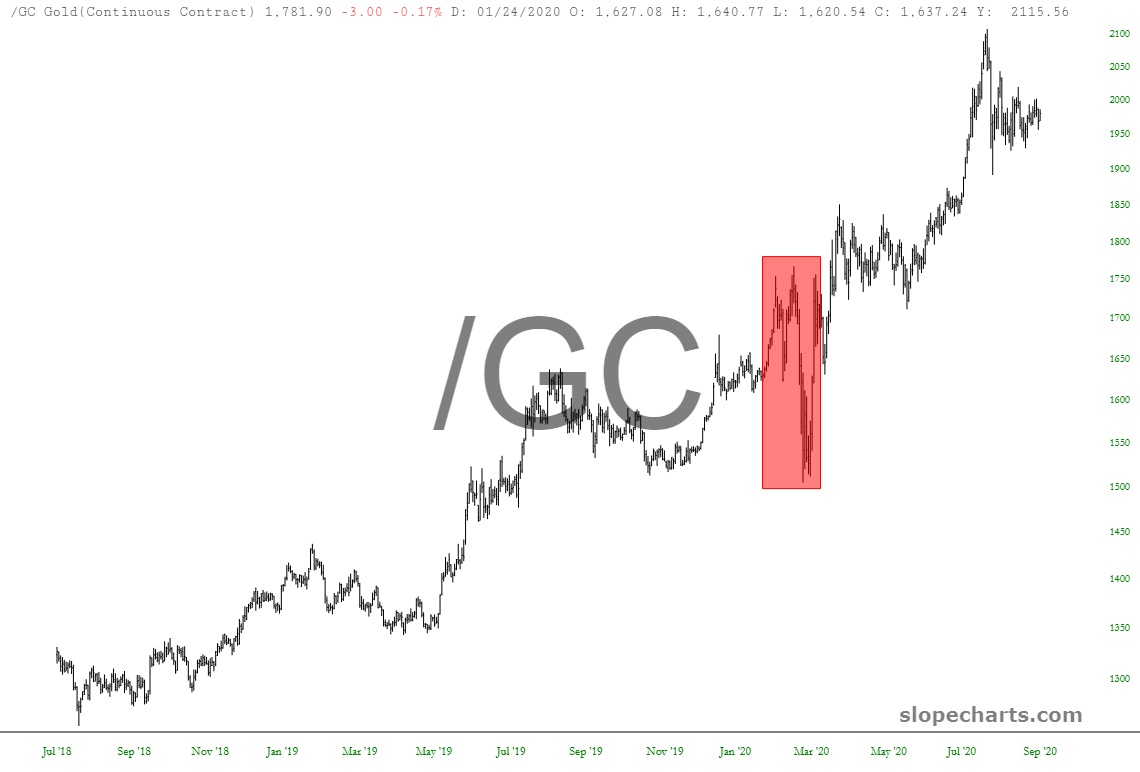
There are numerous fundamental factors which are underpinning our current bull market in oil. I discussed a few them in my August 2020 article “Striking Oil”. For trading purposes, I have continued find the /GC to /CL analog very useful. This analog was discovered by Tom McClellan, and works off the idea that the movements in gold are echoed in oil with a twenty month lag time. You can read about the analog, and how Tom forecasted the April 2020 bottom in oil here.
The chart below shows that analog beginning from the 2018 bottom in gold, which was later echoed in the 2020 bottom in oil. The area that I have highlighted in red is where we are at now. This is the echo of the Covid crash. I believe this can be instructive for analysis in SPX as well, which I’ll discuss later in this article. This phase of the bullish move in oil is forecasted to end with a powerful bullish thrust into next April. For now though, there is the possibility of volatility immediately on the horizon.
When this oil bull market started, no one and I mean no one was bullish on oil. The opposite is true now. It can only go up, right? The oil in Cushing is about to run dry, according to Zero Hedge. Surely it must be about to go straight up to $200/barrel next week, right? I say not so fast my friend.
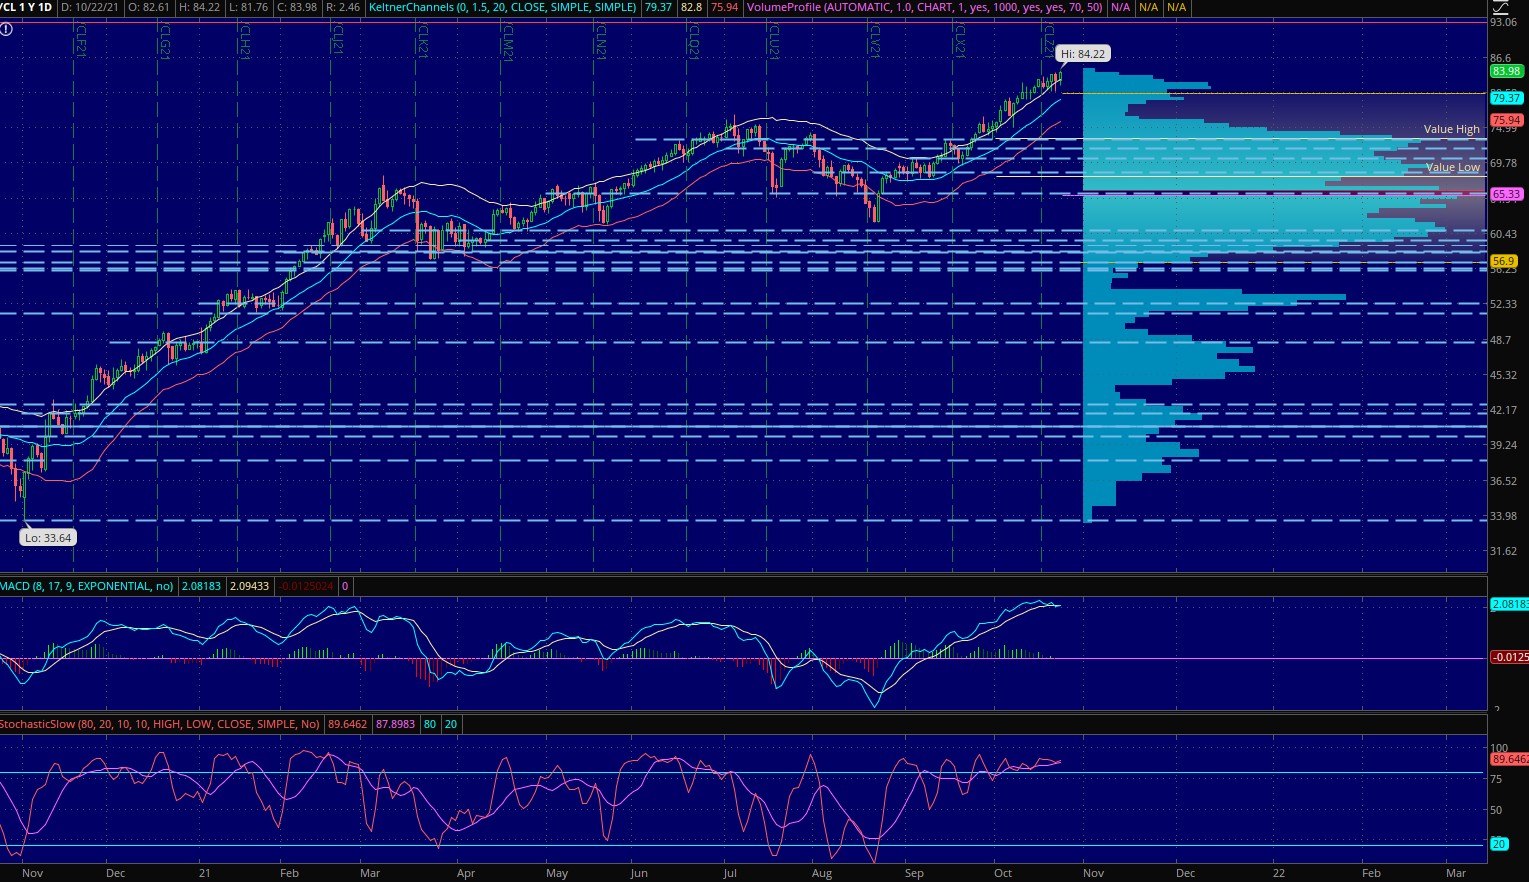
Below is my POC chart of /CL. It’s a busy chart, I know, but getting to peek over my shoulder to see how the doughnuts get made isn’t always pretty. Since breaking above its highest POC at 73.25, /CL has been riding the top Keltner band higher for the past month. It is currently overbought on the daily chart, and looking tired to my eyes. That POC at 73.25 coincides with value high this month, and would be my first target for a pullback.
When I look at the POCs for /CL, there are basically two large clusters of POCs showing. The top cluster goes from 65.60 to 73.25. This is illustrative of the correction we saw in oil over the summer, and the possible support that exists from that consolidation. After this consolidation, a decision was made by the market to push prices higher above 73.25. A pullback to 73.25 would be healthy. A move below 73.25 would be instructive that a more powerful pullback is getting underway.
The lower cluster of POCs runs from 56 to 60.74. This is rock solid support. If we indeed see a selloff in the broader markets and oil, this area of support should give great comfort when looking to re-enter energy positions.
S&P 500
So the Fed is getting ready to taper QE, eh? What we have learned since the 2008 financial crisis, is that global central bank QE has been the fulcrum from which markets turn. Yes, that’s a polite way of saying that markets have been manipulated higher over the past twelve years. This has been led by the U.S. Federal Reserve, and they have owned the stock market over the past twelve years. However, something has changed of late that I believe is setting the stage for central banks to have to make much more difficult choices. Inflation is here.
So what has been the effect of the Fed tapering past rounds of QE? They have been learning. The first round of QE ended rather abruptly, and led to the corrective mess for SPX in 2010 surrounding the flash crash. QE was almost immediately restated with QE2. However, when the Fed ended the last round of QE in 2014, they tapered QE at a much more measured pace, and introduced the concept to the markets leading up to the taper beginning. The effect can be seen in the chart below. The beginning and ending of tapering are circled. The end of that round of QE led to the period of sideways volatility that we saw in 2015.
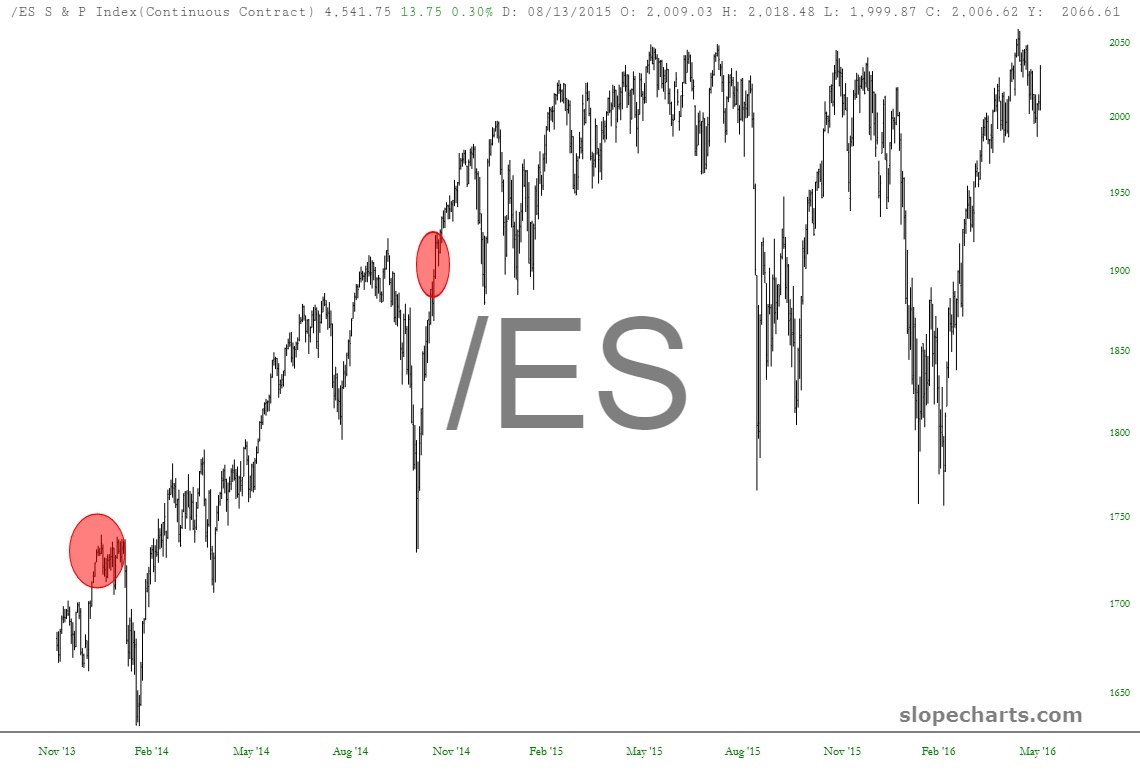
Keep in mind that the economy was in pretty good shape in 2014-2015. I don’t believe that’s the case right now. When the Fed takes its thumb off the scale, the market has to stand on its own two feet as genuine market forces begin to take hold again. Our current economy is a mess. I believe that will become evident in the month/years ahead.
So what can we expect in the near term for SPX? According to the /GC to /CL analog we are approaching the echo of the Covid crash. Is there evidence to suggest that a period of echoing volatility is possible in SPX? Below is my POC chart of /ES. As you can see /ES has formed a similar wedge structure as it did preceding the Covid crash. After initially breaking down from the wedge, /ES made one final thrust higher to new highs before the selloff began. This has been replicated in our current market again now.
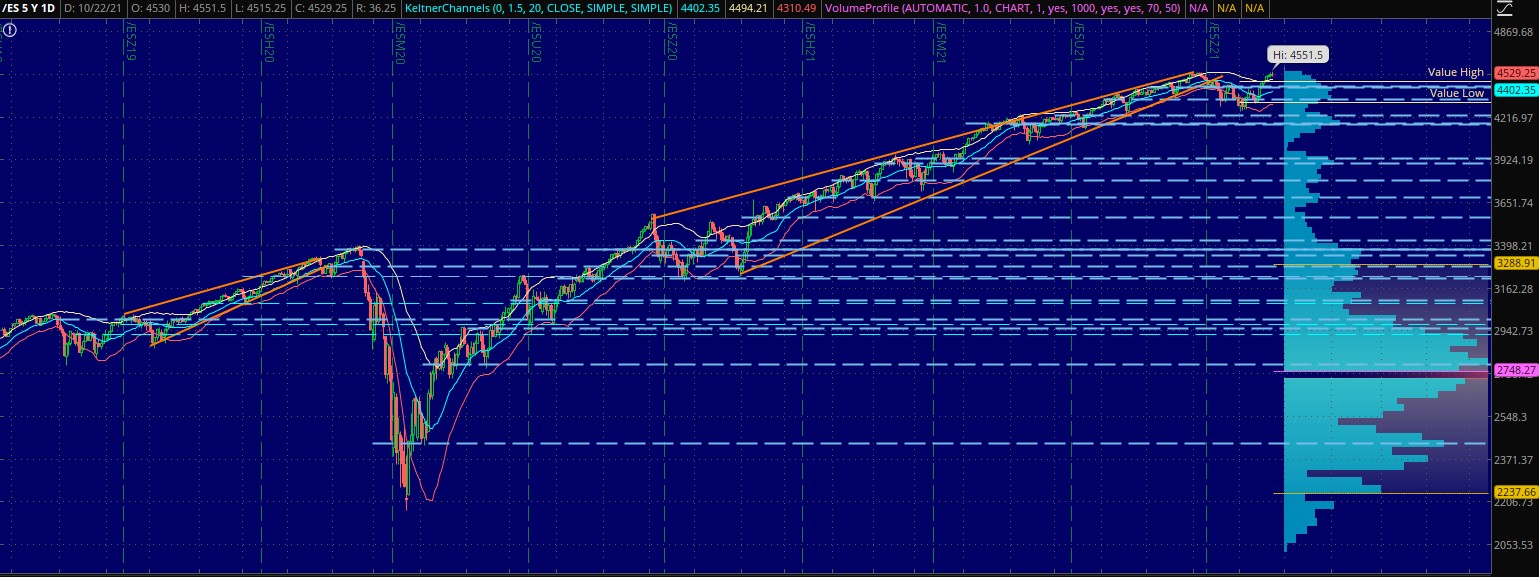
I do not expect the severity of the Covid crash to be repeated; however I am expecting a selloff in markets to take place over the course of the next month. /ES is currently overbought on the daily chart, and hanging out just above value high for the month. Should we begin to turn down in earnest next week, this gives the opportunity for a clean, easy entry on the short side. Value high this month is at 4477. A break below that level has the implication of a move down to value low at least, which is at 4320. This is the start of a good trade. If /ES moves below 4477, enter short with a stop back above 4477.
If this scenario begins to transpire, a move below value low would be a signal to me that a more powerful move is underway, and I’ll be looking for moments of panic to try to understand when the move is bottoming. Key levels to my eye that may possibly offer support are the cluster of two POCs around 4174, 3931, or possibly the pre-Covid highs of 3374 if things really got out of control. I think the most likely scenario is a selloff back down to 3931ish.
To wrap things up, I am currently positioned with 95% cash. I have two options positions. I am long ARKG Dec 73 puts, and UVXY Dec 21 calls. If we indeed see a selloff over the course of the next month, I will look for a moment of bottoming panic to get back fully long my basket of oil companies and MLPs for an anticipated explosive move higher in oil into next spring. Happy hunting!
