

War damage in Kiev (Алесь Усцінаў/Pexels).
Market Bounces Despite Increasing Risks
Last week was the second week in a row that the S&P 500 traded higher. The market has now regained all of its losses from Russia’s invasion of Ukraine, but it’s not clear that the risk environment is better. On the contrary, geopolitical and economic risks seem to have increased over the last month. The biggest risk remains the war between Russia and Ukraine escalating to one between NATO and Russia. On that score, we’ve had some concerning news in recent days.
Most recently, President Biden called for Russian President Putin’s removal, before a White House staffer attempted to walk it back.
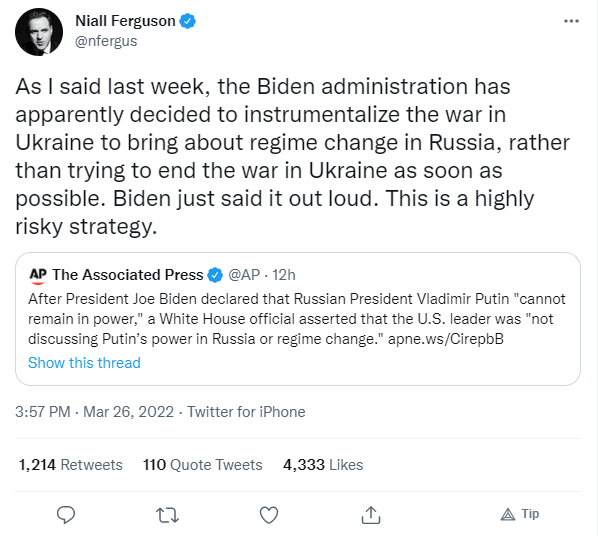
This sort of gaffe might have been less concerning if diplomatic channels between the U.S. and Russia were open, but apparently U.S. Secretary of State Anthony Blinken hasn’t spoken with his Russian counterpart, Foreign Minister Sergey Lavrov, since before the war started. High level military channels don’t seem to be open either: the Washington Post reported last week that calls by the U.S. Secretary of Defense and Chairman of the Joint Chiefs of Staff have gone unanswered by their Russian counterparts.
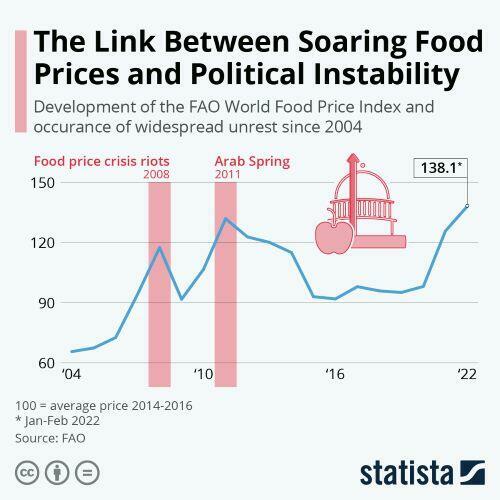
Another danger is that geopolitical and economic risks can feed into each other. We’ve seen food and energy costs spike in the wake of the war in Ukraine and sanctions in response to it, and as ZeroHedge noted citing the Statista chart graphic below, there’s a historical correlation between high food prices and political instability.
In short, the market has bounced in spite of these risks over the last two weeks; as the Market Ear pointed out on Friday, this may be a good time to hedge.
Here’s a relatively cheap way to protect your portfolio now.
Setting Initial Conditions
For the purposes of this example, we’ll assume your portfolio is worth $500,000, and that it’s closely correlated with SPY. We’ll also assume you have enough diversification within it to protect against stock-specific risk, and that you can tolerate a decline of up to 20%. If you have a smaller risk tolerance, you can use the same approach entering a smaller decline threshold, Similarly, if you have a larger or smaller portfolio, you can adjust Step 1 below accordingly. If you have gold, bonds, or other asset classes in your portfolio, we’ll address that at the end.
Hedging Stock Market Risk
Step 1
Divide the dollar value of your portfolio by the current price of SPY. For this example, we’ll use numbers as of Friday’s close, but obviously, you’ll use current data when you do it. SPY closed at $452.29 on Friday. Dividing $500,000 by $452.29 gets you 1,105 shares (rounded up).
Step 2
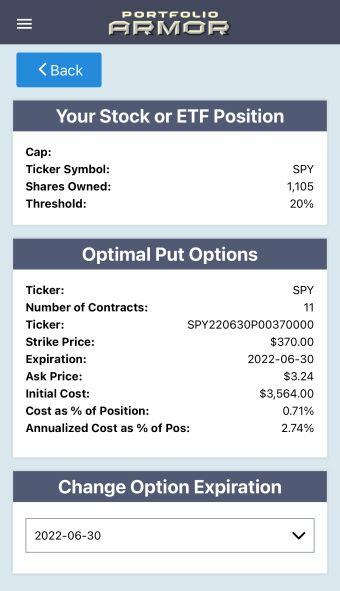
Scan for the optimal, or least expensive, puts to protect against a >20% decline in your number of shares of SPY at the options expiration you want. We’ve selected the June 30th expiration below. It’s far enough out to give you some breathing room, and it’s not too expensive.
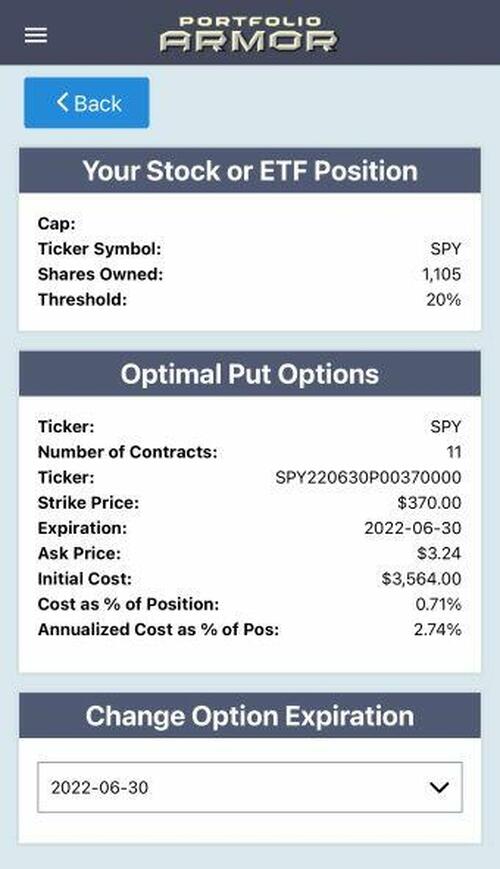
This and the next screen capture are via the Portfolio Armor iPhone app, but our website scans for optimal hedges too.
As you can see above, the number of options contracts the algorithm presented was 11. Since each options contract covers 100 shares, what our algorithm does when you enter a number containing an odd lot like 1,105 is this: it slightly over-hedges the round lots (the 1,100 shares, in this case), so that your entire position, including those extra 5 shares, is protected against the drawdown you specified.
Note the cost here: $3,564, or 0.71% of portfolio value. The app calculated that conservatively, using the ask price of the puts (in practice, you can often buy options at some price between the bid and ask prices).
Step 3
Round up the number of SPY shares to the nearest 100 and repeat step 2.
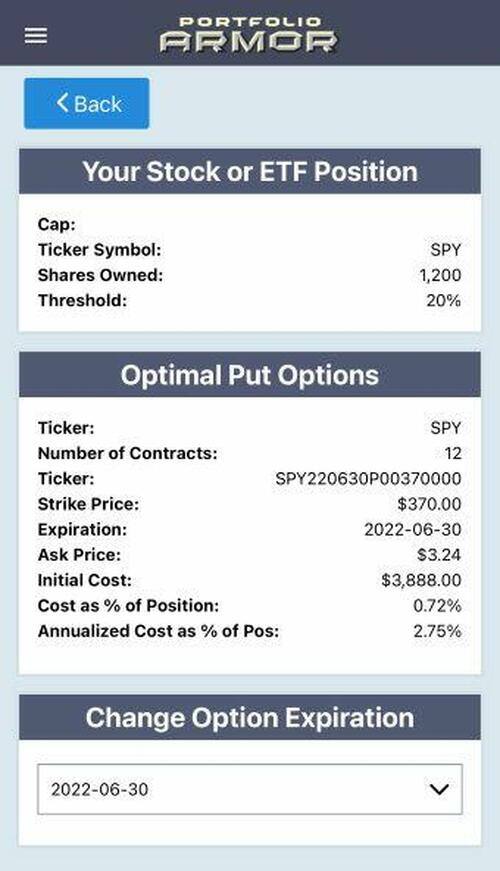
Note that, in this case, it was cheaper to hedge 1,105 shares using the first hedge, so you would go with that.
Hedging Other Asset Classes
In our simplified example above, your portfolio was 100% stocks that were highly correlated with SPY. Let’s say your portfolio includes a broader range of asset classes: 40% diversified stocks, 20% tech stocks, 40% bonds. You could use the same approach as above using QQQ as the ticker for the tech stocks, TLT or LQD for the bonds (depending if they’re Treasuries or corporates). So, in that case, you’d divide the dollar amount of your tech stocks by the current price of QQQ, etc.
