
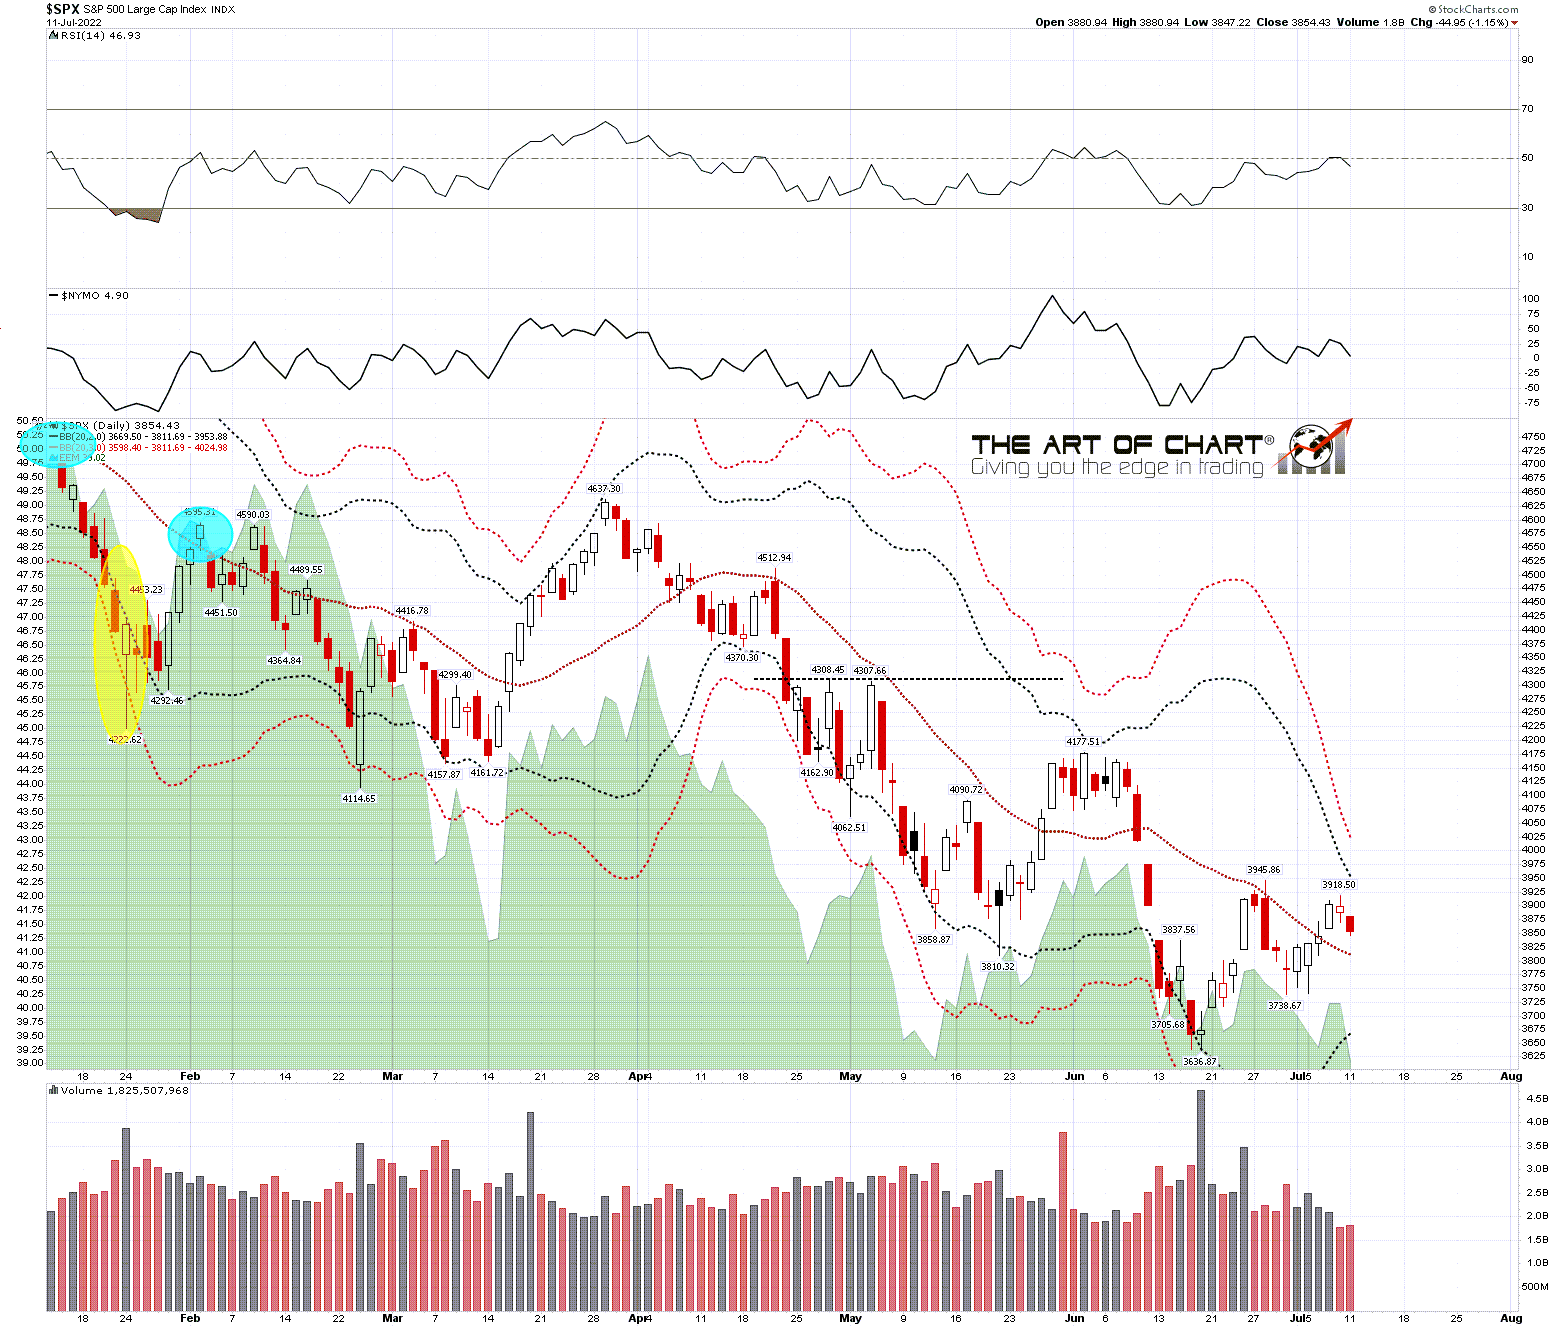
SPX is retracing and is likely to open today below the monthly pivot at 3867 and the weekly pivot at 3853. That opens a possible backtest of the daily middle band, currently in the 3812 area, and a close below and conversion of that to resistance would open a possible 2022 low retest.
Am I expecting to see that directly from here? No, but it is a possibility.
SPX daily BBs chart:
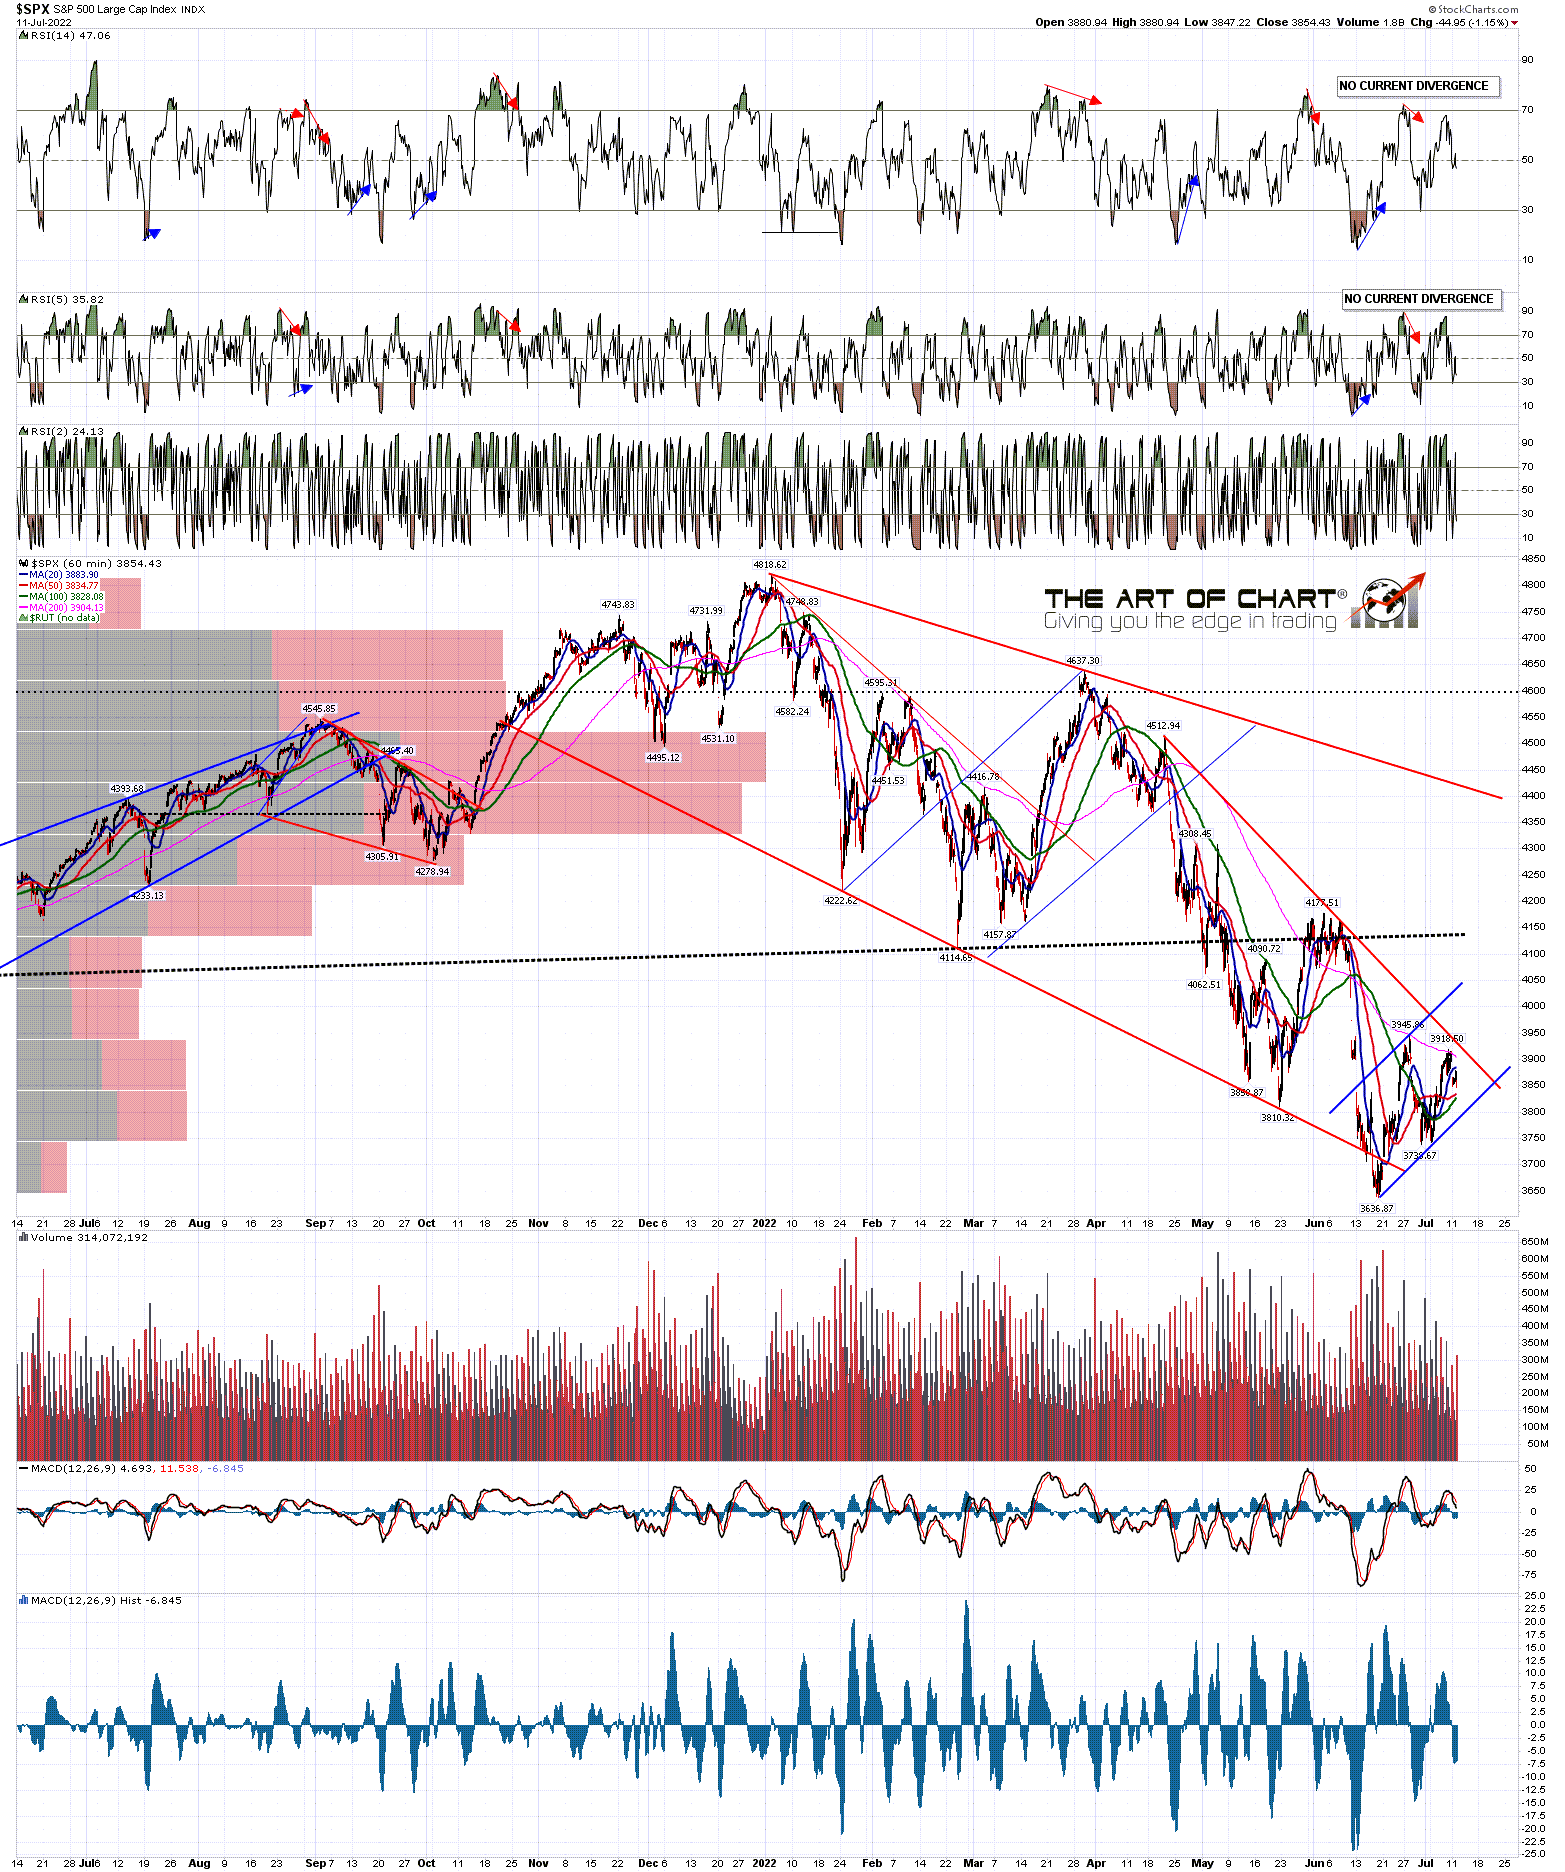
What I am expecting to see is a higher high on this rally (Editor’s note from Tim: not me!), above the previous high at 3945.86 as if this is a bear flag forming, as it may well be, there would generally be a higher high coming unless this is a bearish triangle forming, which is possible, but not obviously the case as I write. There is however some shorter term trendline resistance in the 3940 area that would need to be broken to deliver that higher high.
SPX 60min chart:
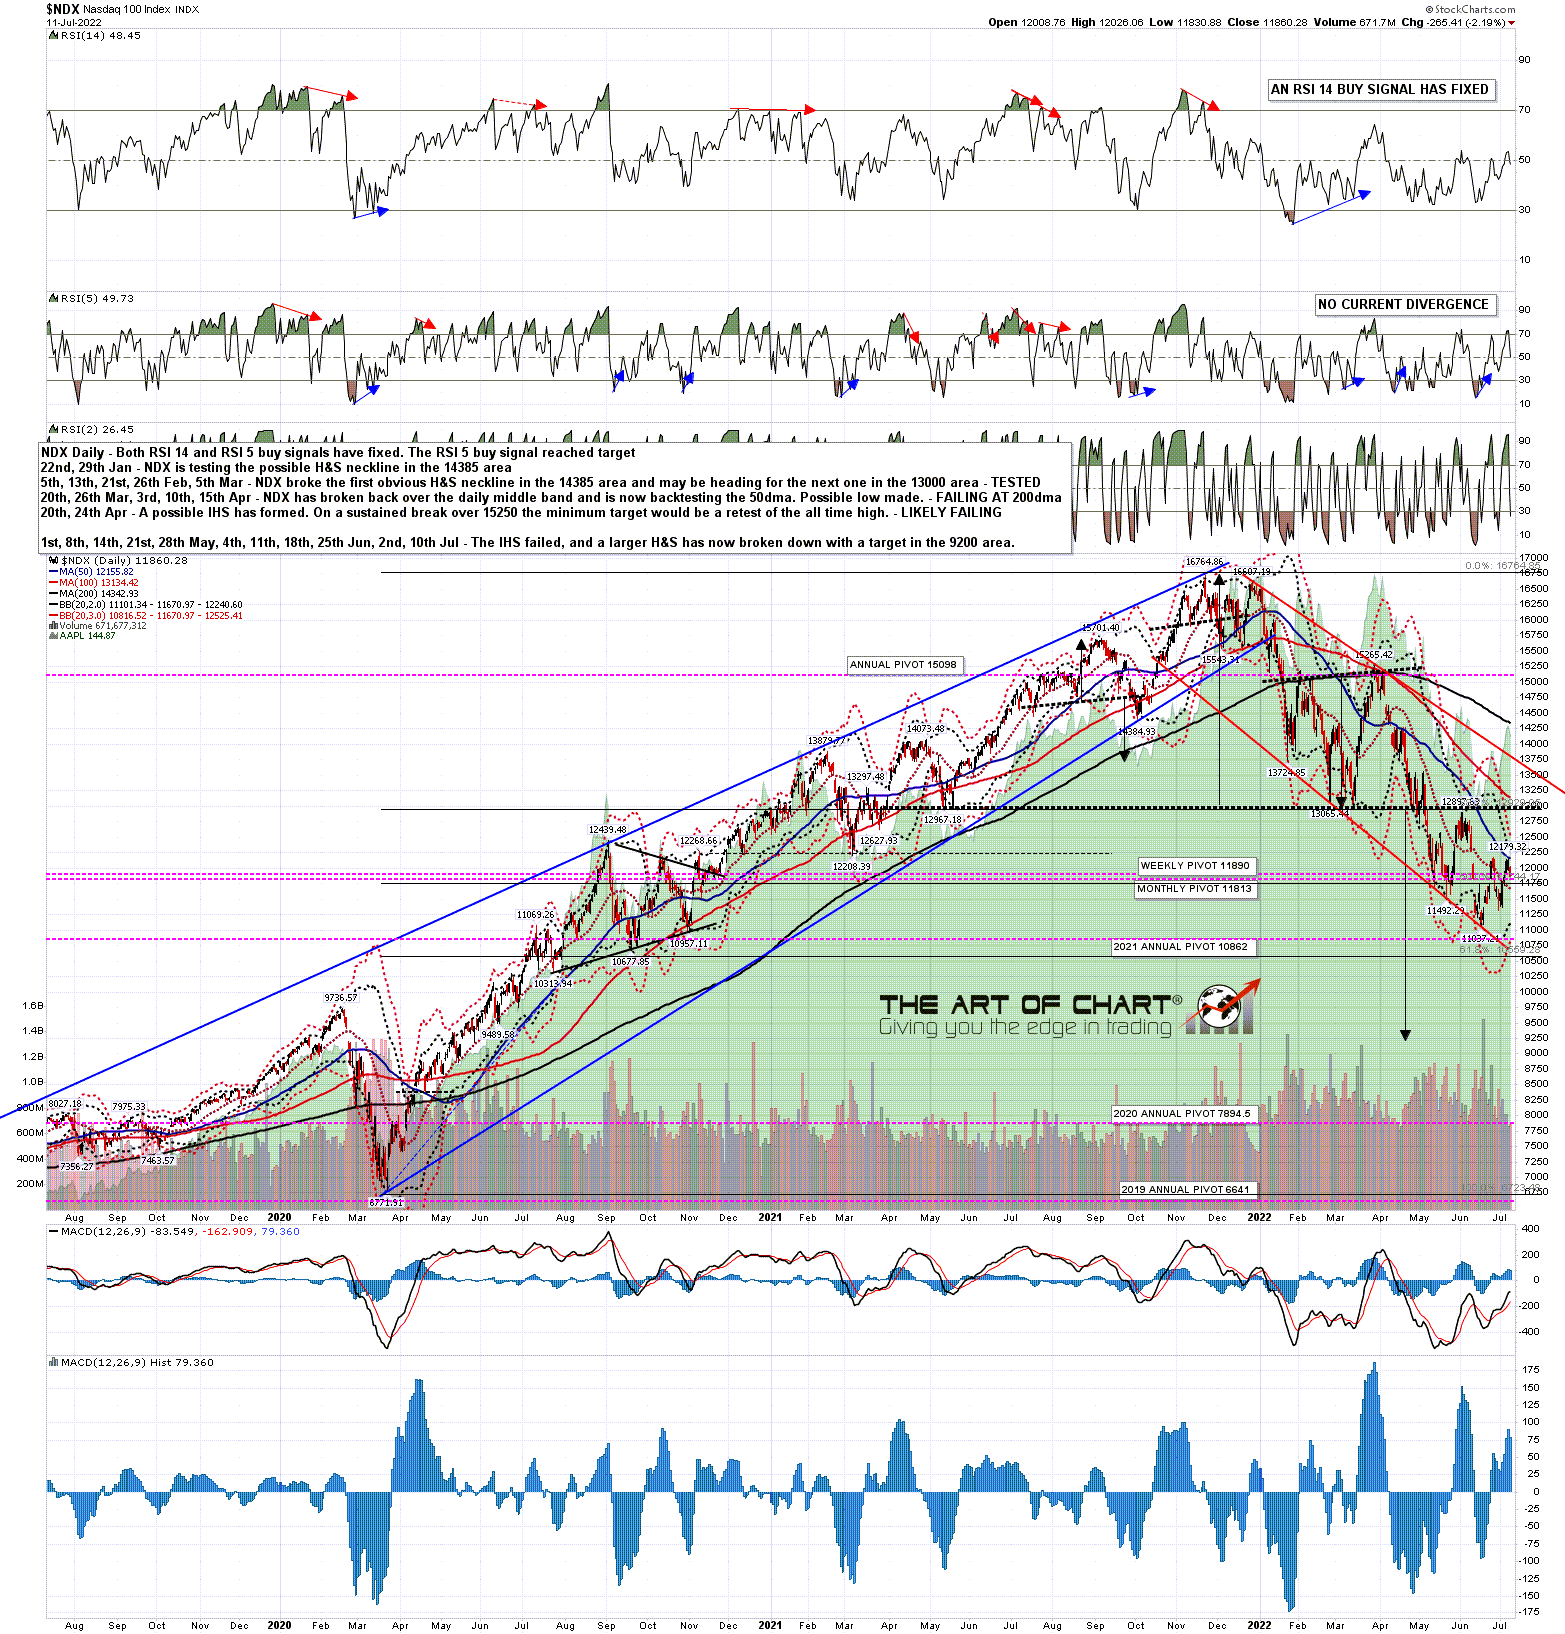
On NDX, which has been leading this rally, the high so far has been at the test of the 50dma, which is a good resistance level on NDX. A break and conversion of that to support would be a step on the way to opening a path to the higher main target on SPX at the weekly middle band, currently at 4137.
NDX daily chart:
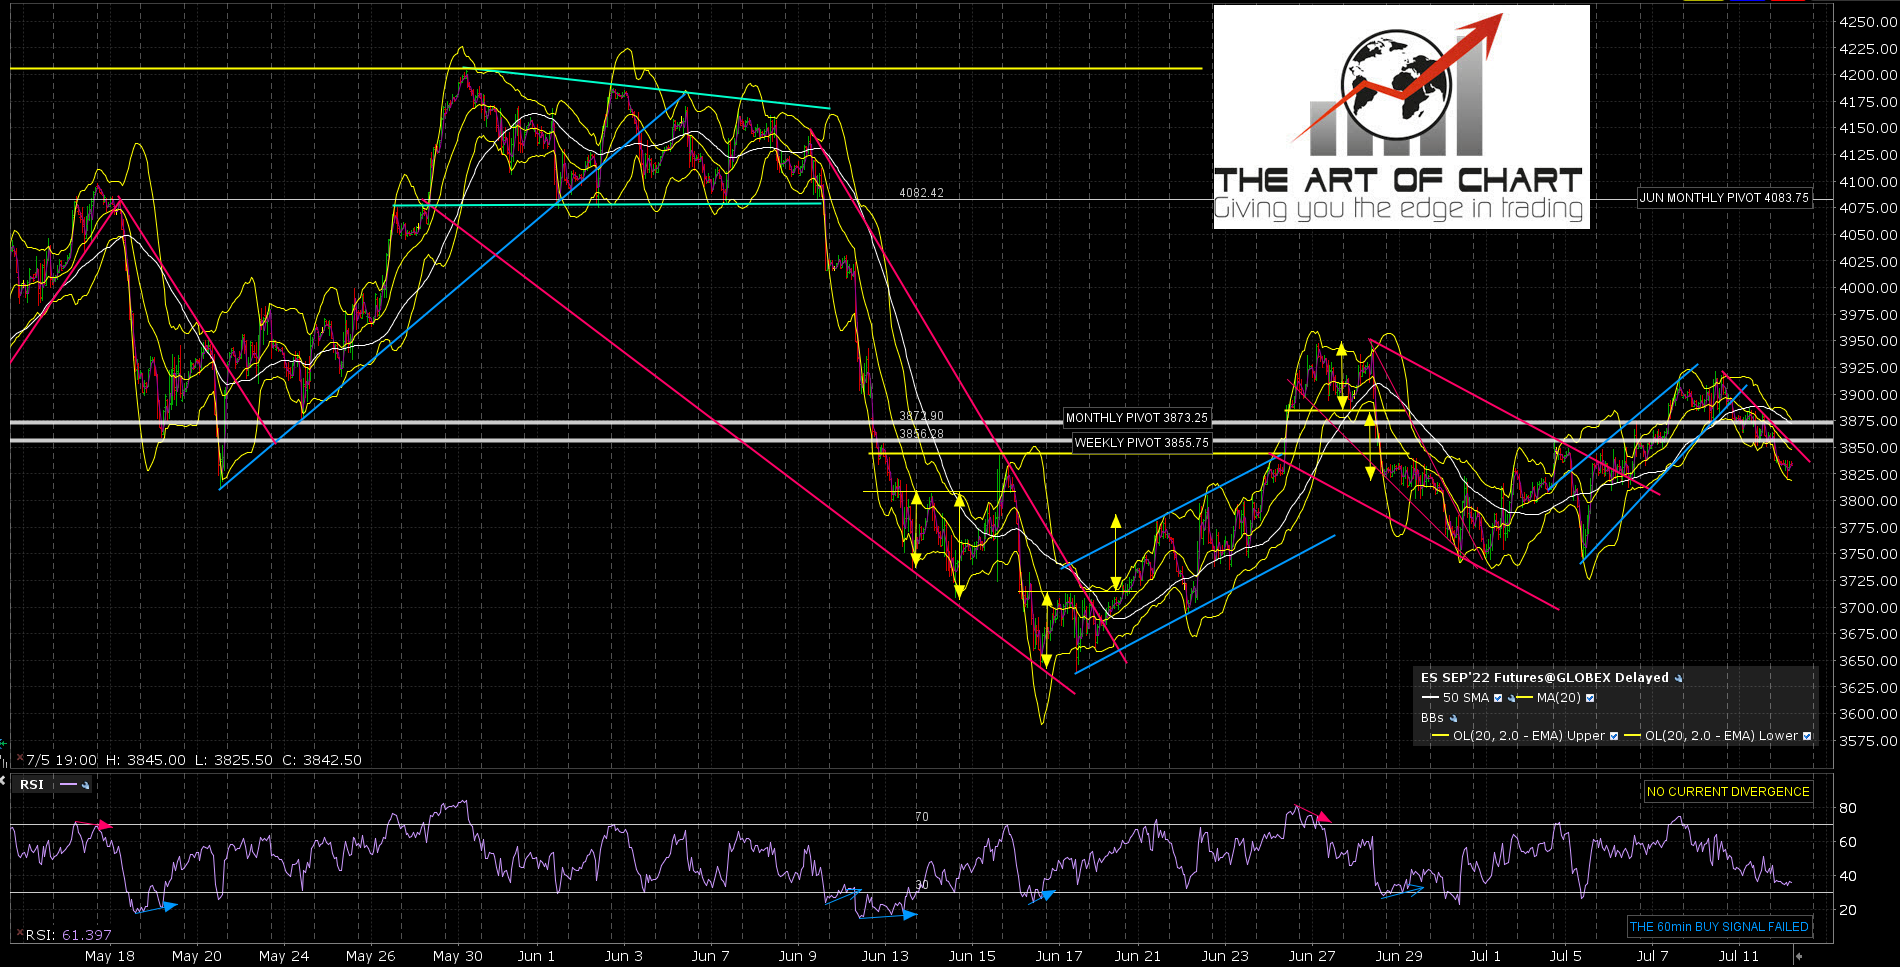
In the short term the action on ES since the high on Friday looks like a bull flag forming.
ES Sep daily chart:
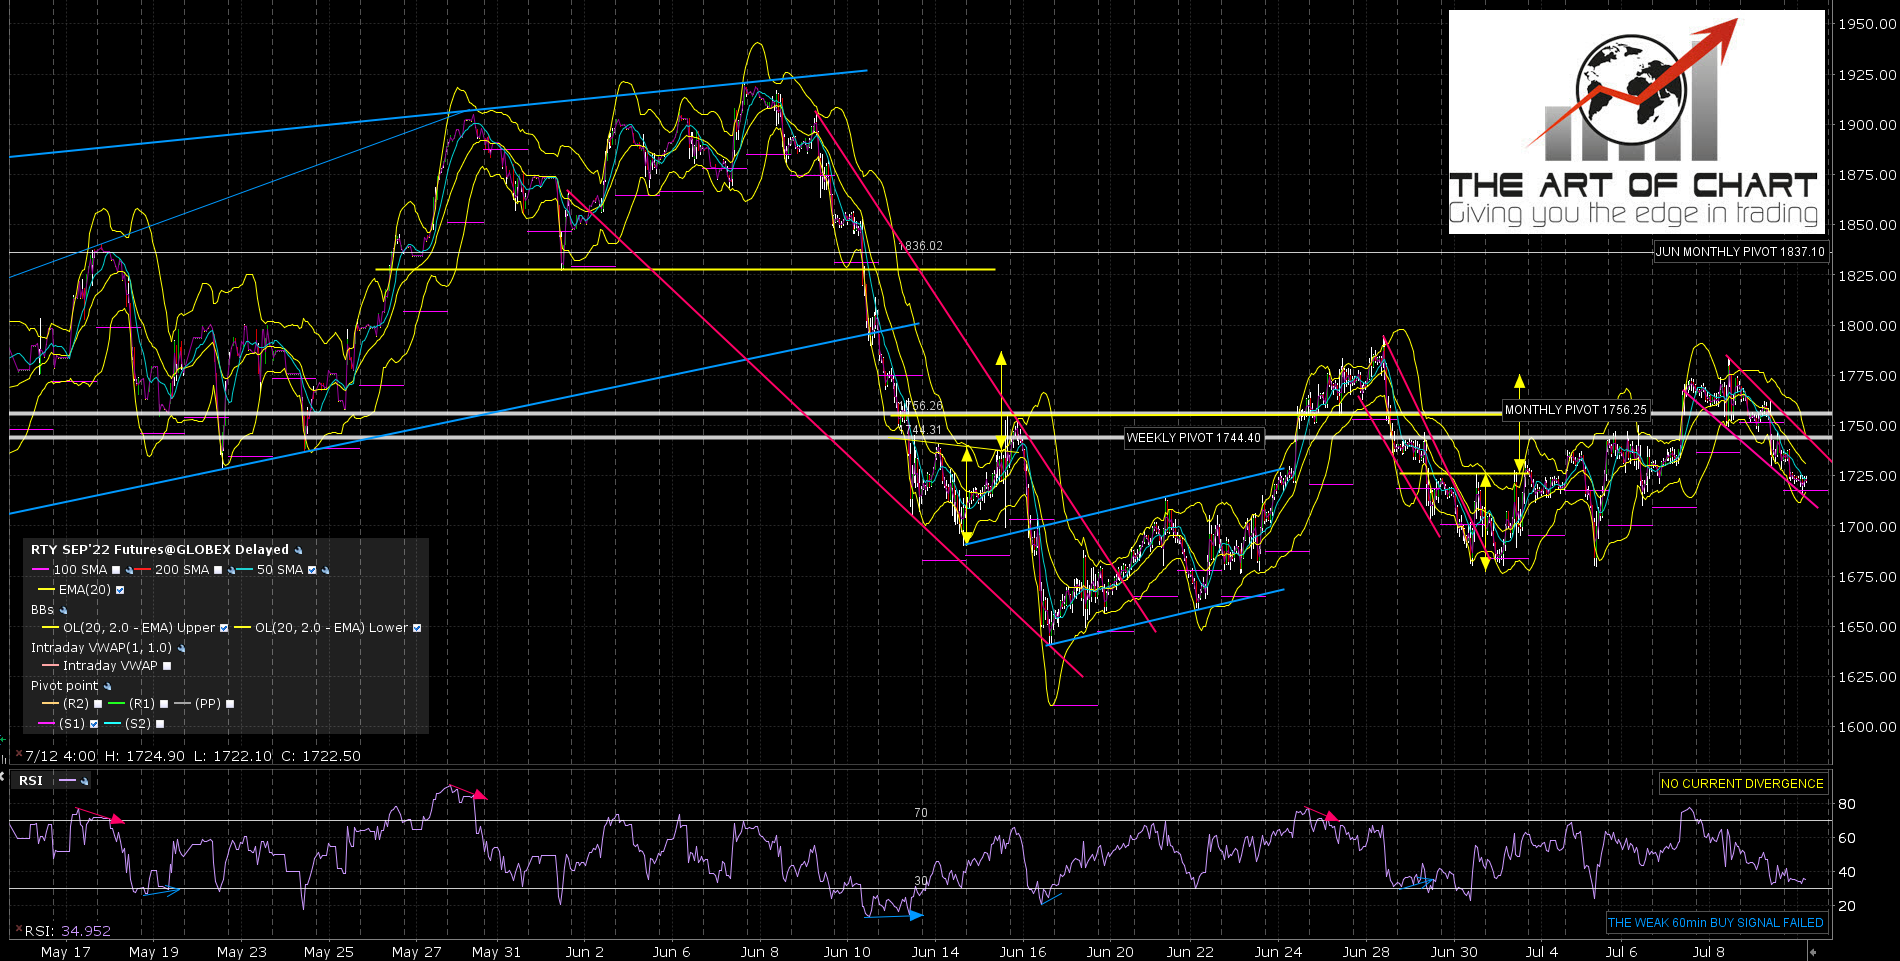
……. and there is an even nicer bull flag setup forming on RTY.
RTY Sep daily chart:
The historical stats this week are modestly bullish leaning today, and strongly bullish on Wednesday (81%) and Thursday (71%) this week. The next bearish leaning day is opex on Friday at 38% green closes. These historical stats don’t control direction of course, but they do tell us whether the bulls or bears have the wind at their backs or are pushing into it on any particular day. They deliver a lot and I’m always keeping an eye on them.
If you’re wondering where I get these daily historical stats from, I get those from the Stock Trader’s Almanac 2022 by Jeffrey A Hirsch. I’ve been getting one at the start of every year for many years now and they are available from Amazon in the US and elsewhere.
We did our monthly free public Chart Chat on Sunday at 4pm Eastern Time and if you missed that you can see the recording here or on our July Free Webinars page.
