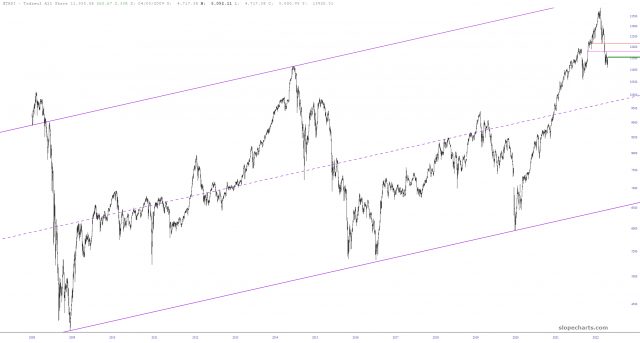
I was looking at the Tadawul All Share Index (symbol $TASI) from Saudi Arabia, and its cyclic nature was quite intriguing.

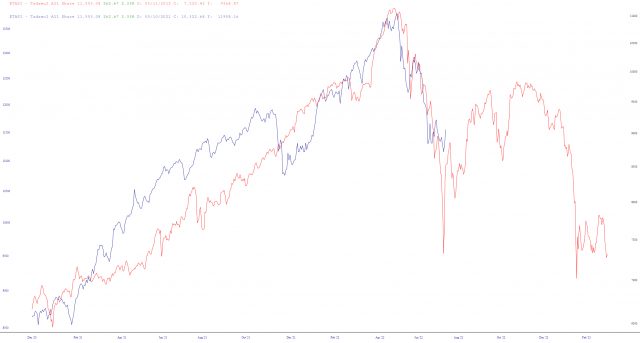
Naturally I wanted to check out the preset price activity (blue line) with the prior instance (red line) via Layered Charts.


I was looking at the Tadawul All Share Index (symbol $TASI) from Saudi Arabia, and its cyclic nature was quite intriguing.

Naturally I wanted to check out the preset price activity (blue line) with the prior instance (red line) via Layered Charts.
