
Preface from Tim: Beloved Sloper Buccaneer was kind enough to answer my “call for content” during my most desperate hour (that is, since I’m traveling) and submitted a huge post which I’ve broken into several parts, not just because it’s so danged big, but also to stretch out the content for my own purposes. Thank you, Bucc! Part 1 is here.
Implied Volatility (IV) and Implied Volatility Rank (IVR)
Implied Volatility (the expected % move in an underlying) is a standardized metric for the general level of options prices for a given underlying. Option prices do not imply a direction regarding the underlying’s movement, they imply only the probable distribution or expected price range of the underlying. For example, SPX has an IV of 20 means that SPX is expected to move within an expected range of 20% for the year. Its option prices will be priced to anticipate a 20% move. When Implied Volatility increases, probability OTM decreases. When Implied Volatility decreases, probability OTM increases. IV is a dynamic figure that changes based on activity in the options marketplace. When IV increases, the price of options will increase as well. When IV is high you should increase your size, and when IV is low you should reduce your size.
To calculate Implied Volatility Expected Move:
% EM = IV / square root of (365 / DTE)
To convert annual IV to monthly:
annual IV / square root (12 / t)
t = 1 month; square root (12 / 1) = 3.464; 50% / 3.464 = 14.43%
To speed up the conversion process:
From annual IV to monthly IV, divide by 3.5
From annual IV to weekly IV, divide by 7.25
From annual IV to daily IV, divide by 19

Figure 5: Slope Of Hope’s Expected Move (EM) cone for SPY.

Figure 6: TOS EM cone for SPX.
The range of the cone is the range that options are going to be anticipating (pricing in) for that given time frame.
Implied Volatility Rank (how big the Expected Move is relative to the past year) is a standardized metric that gauges how expensive options are right now compared to the past year. For example, SPX has an IVR of 20 means that SPX Expected Move (EM), option prices at the moment, is in the bottom 20th percentile over the past year.
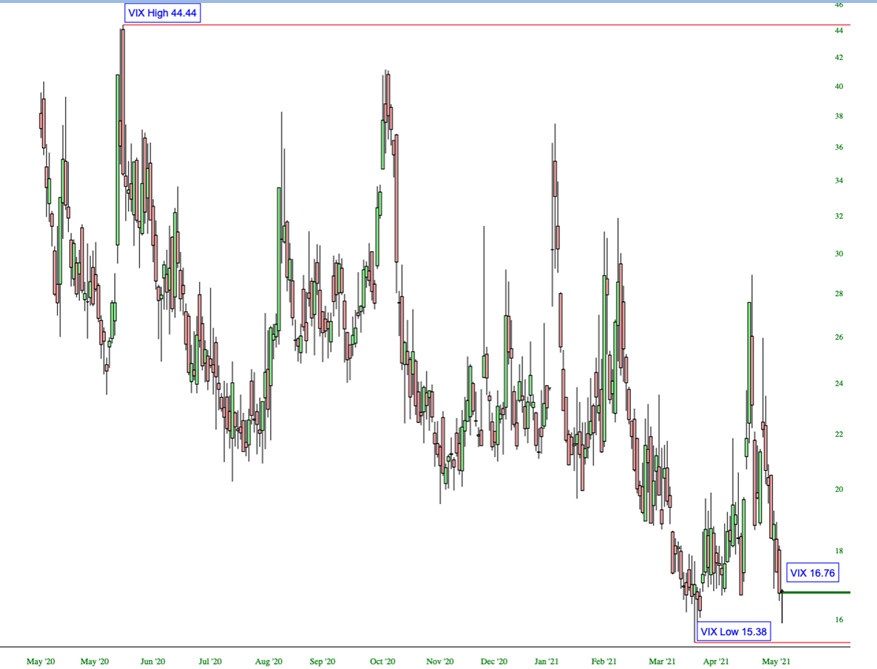
Figure 7: SOH chart of VIX (IV of S&P 500) yearly pinpointing the high and the low. Showing where volatility is right now relative to that high and low point.
The difference between IV and IVR is important because SPX could have a high IV with a low IVR (meaning options anticipate large ranges, but smaller than ranges in the past year), or a low IV with a high IVR (meaning options anticipate small ranges, but are still much larger than ranges in the past year).
Volatility Skew
Volatility Skew refers to the difference in IV of each opposite, equidistant options. The current volatility skew in the market results in puts trading richer than calls, because the IV in OTM Puts is higher than the equivalent OTM Calls. Velocity also attributes to the skew, since markets can fall much faster than they rise.
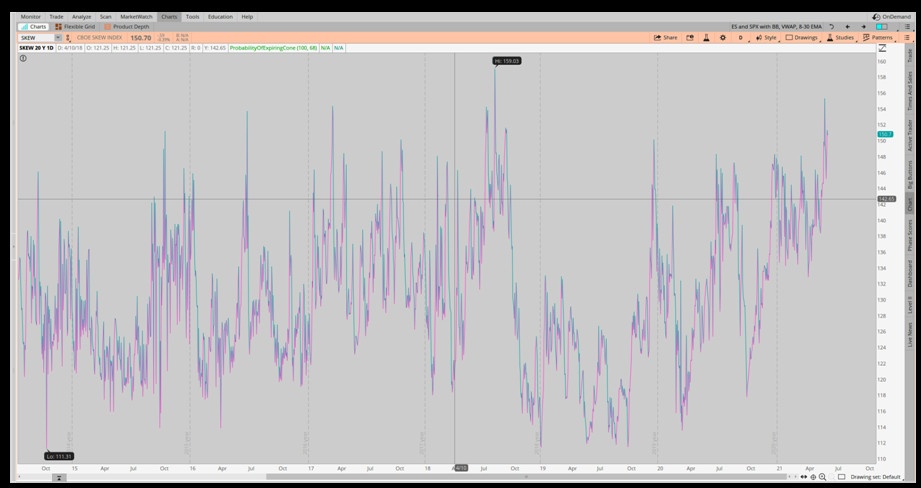
Figure 8: TOS SKEW Index chart.
Theta and Time Decay
Time Decay is the amount of money you collect for the sold Premium of your option trades. Selling volatility is considered the same thing as Theta Decay. We make money by just letting time go by.
Theta is the daily decay of an option’s extrinsic value. If we have positive Theta, we’re on the right side of the coin. To obtain positive Theta, we can sell options. All options with time left until expiration will have extrinsic value. As an option seller, this decay is a good thing. Let’s say we sell a put for $1.00. To close the position, I need to buy back that same option. In order to realize profit, I need to buy the option back at a lower price. This is why Theta is shown as a positive value for option sellers. The daily decay of an option price will help us realize that profit sooner. This is why we prefer selling a Vertical Spread
If we have negative Theta, we’re on the wrong side of the coin. To obtain negative Theta, we would have to buy options. We are trading against the clock. The extrinsic value of our options will dissipate over time, which means we have to be directionally right quickly in order to see a profit, or we need IV to expand more than Theta will decay the option. This is why we always hedge our long options with a short option. We prefer Long Vertical Spreads, Calendar Spreads, and Diagonal Spreads compared to long Naked options, because we can eliminate a lot of the decay, if not all of it.
More to come!
