
There is a small improvement in the Volume Profile technical indicator I wanted to mention, and it is the ability to adjust the Bar Width:
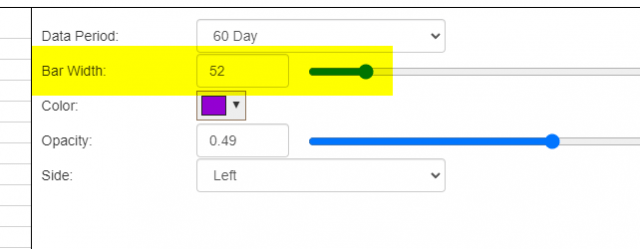
By default, when volume profile is shown, it presents the most finely-grained representation it can of the volume data based on price levels.

If you would prefer a cruder representation of these bars, you can slide the Bar Width bar to increase the range of price levels represented by each bar. The term “cruder representation” should not be confused with “inferior“, because it is often better to see data represented in a consolidated fashion to get a better idea as to where important levels are, much the same way that traders use monthly or quarterly bar charts even when daily charts are available.
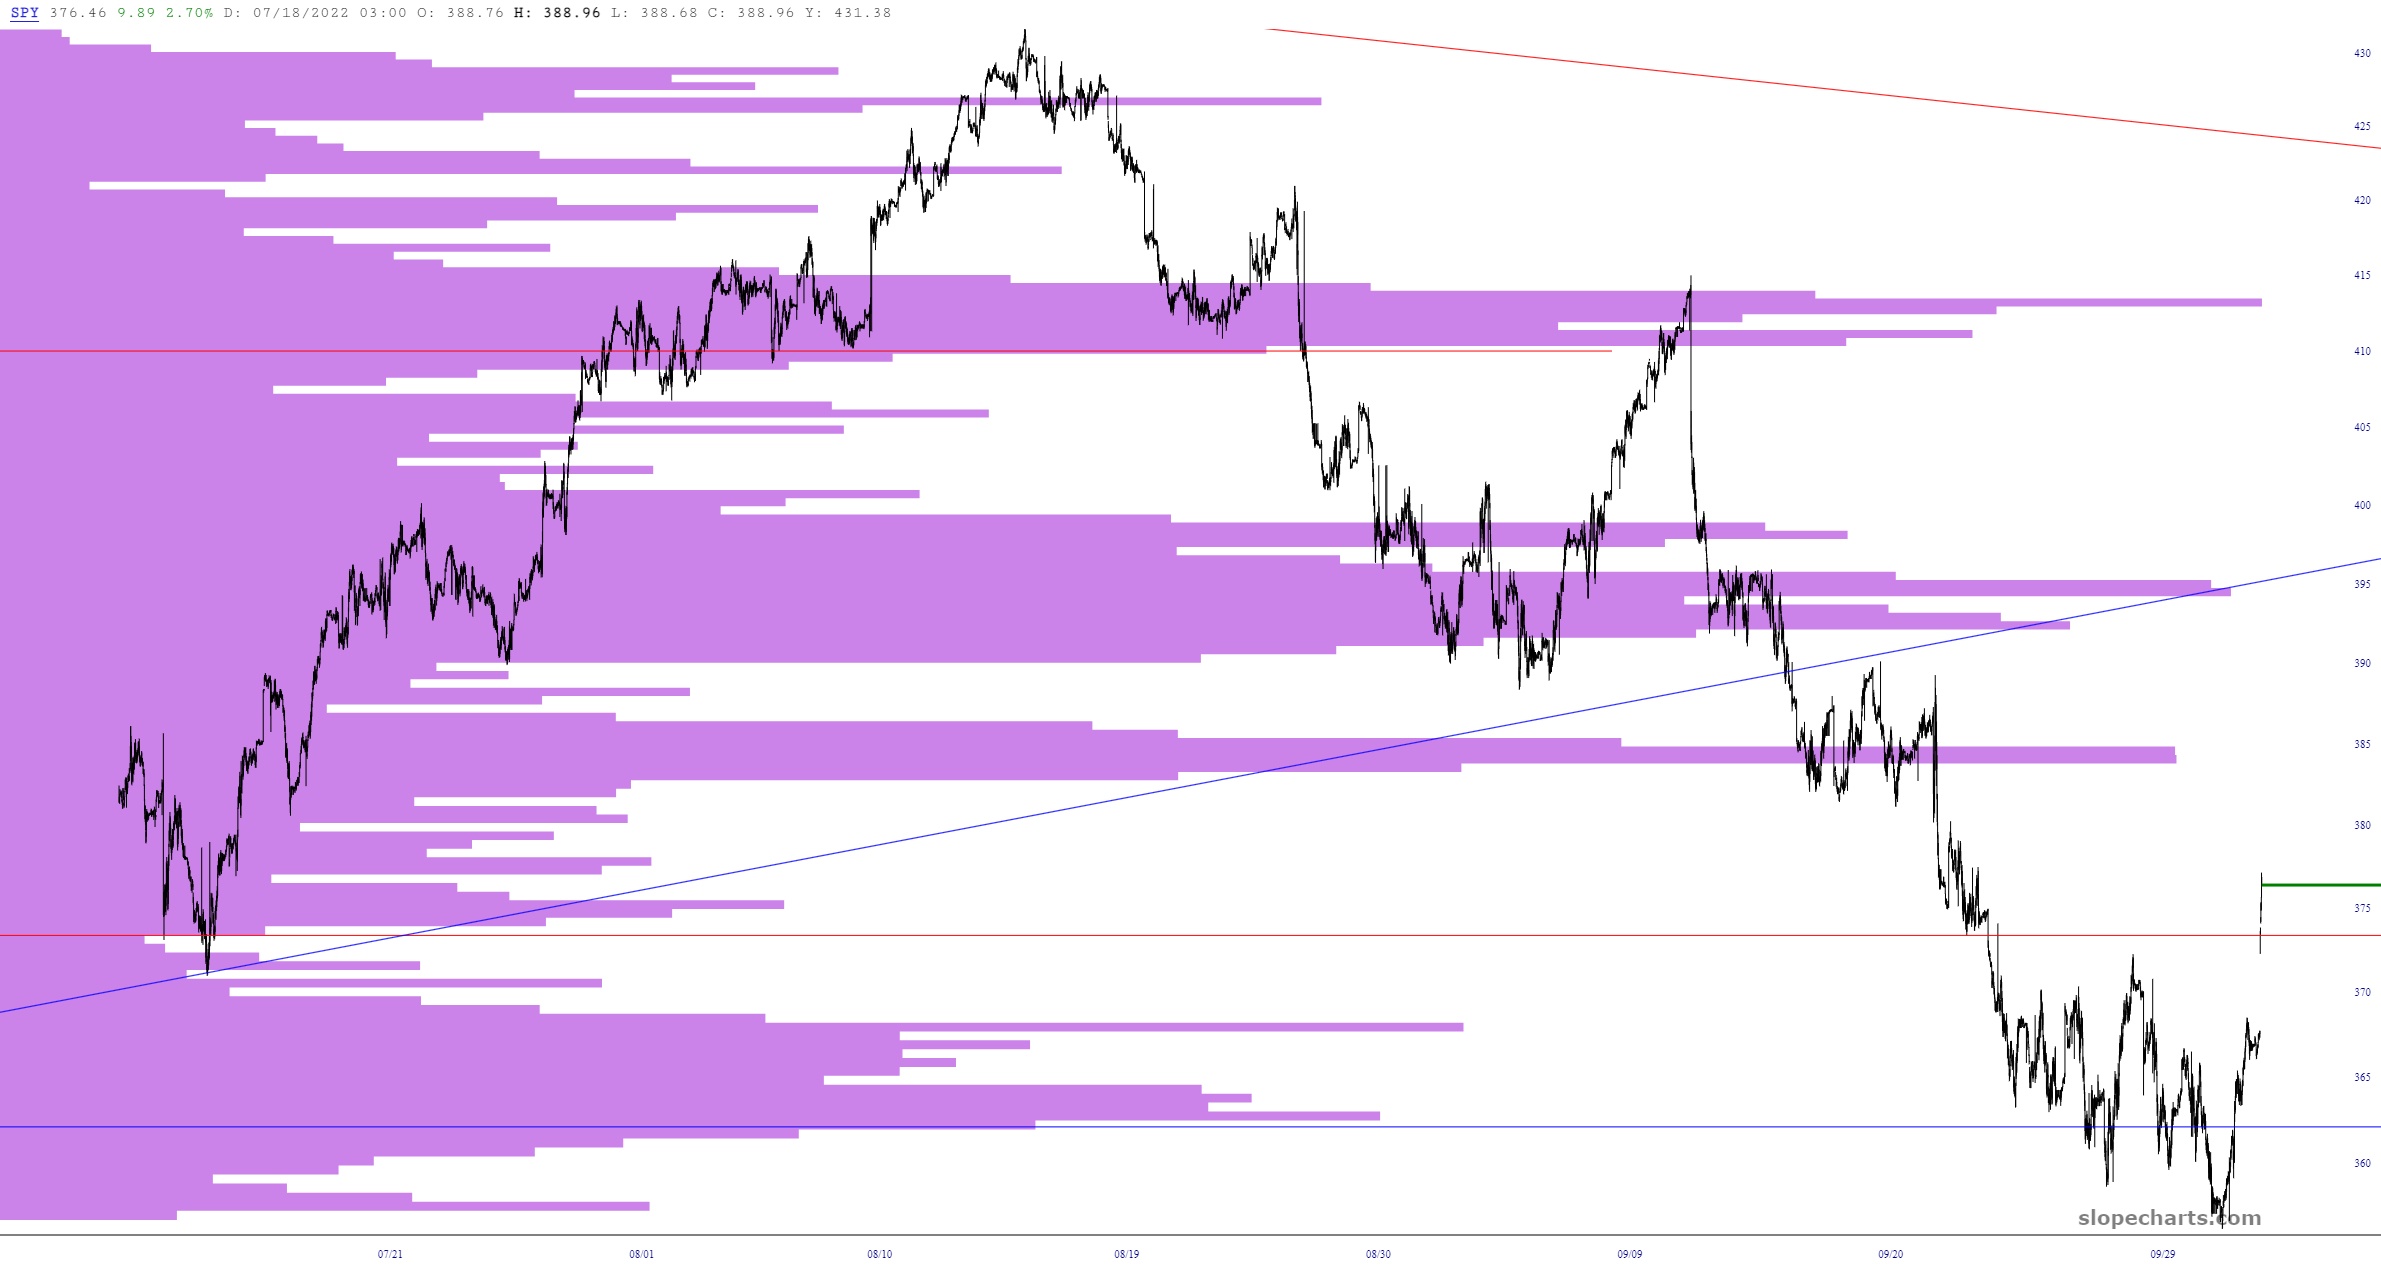
Having said that, it looks like the most serious barrier to further price ascent on the SPY is at about $385.
