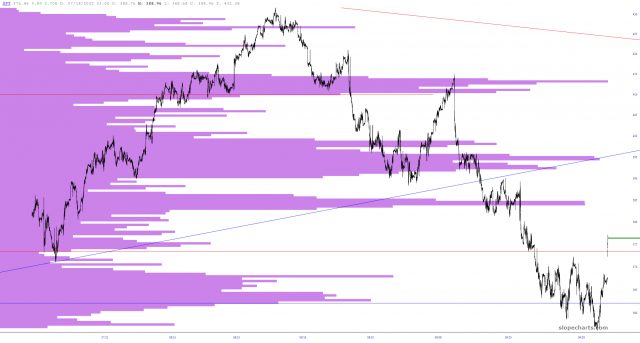
Volume Profile is accessed via the same Technical Indicators dialog box where all the other studies live. You have several controls: the ability to change the color of the volume profile, the opacity, and whether or not the profile is anchored to the left or right side of the screen.
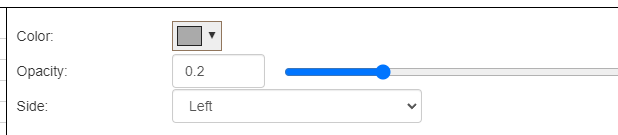
You will also see a dropdown in the parameters for this study which lets you choose how much volume data you want analyzed: from as little as the most recent trading day all the way to “All”, which constitutes about twenty months of intraday data. This is invaluable, because not only does it let you get a much more comprehensive data set for your analysis, but it lets you control how much back-data is being included with your price chart.
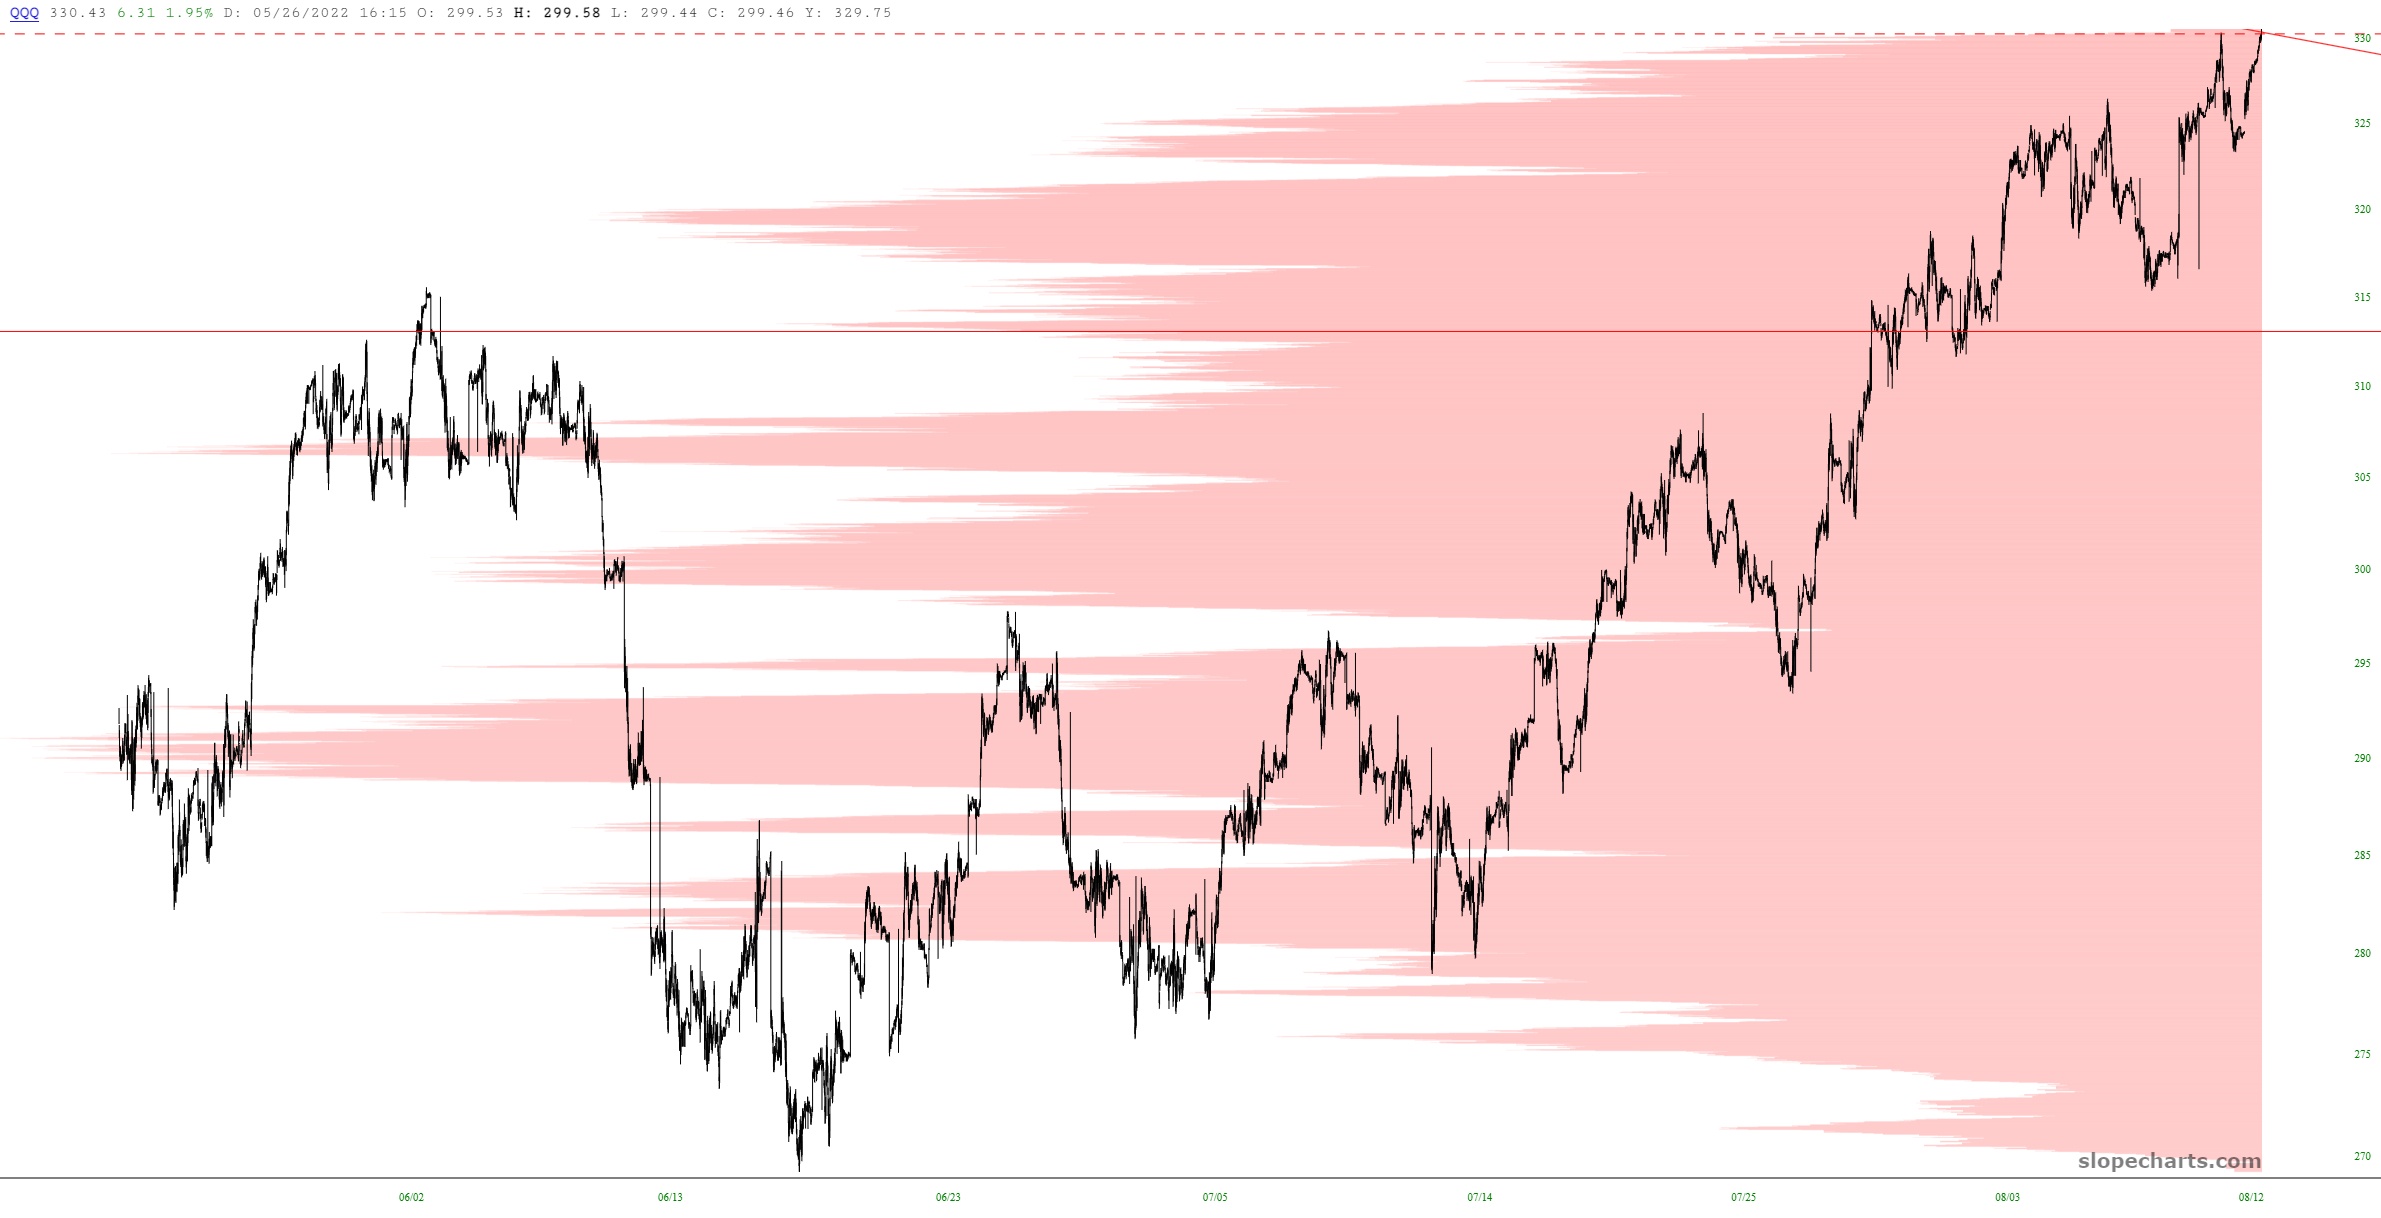
Here, for example, is the SPY with daily price bars:

You can change this to a 60-day intraday chart and see the same information on a fine timescale:

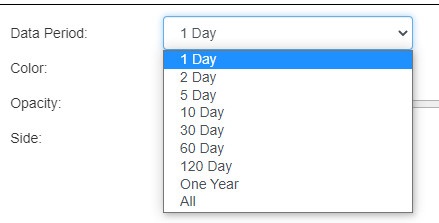
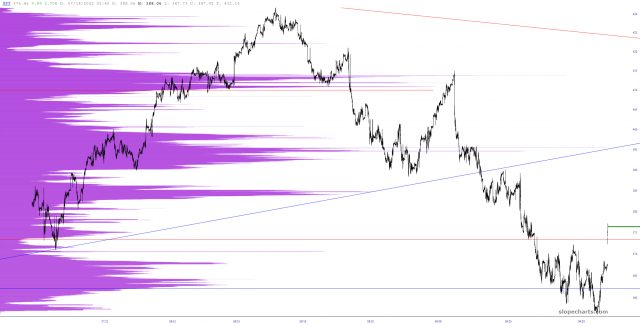
As another example, here is the QQQ with 60 days of intraday data, using a different color and side just to show the difference in appearance.
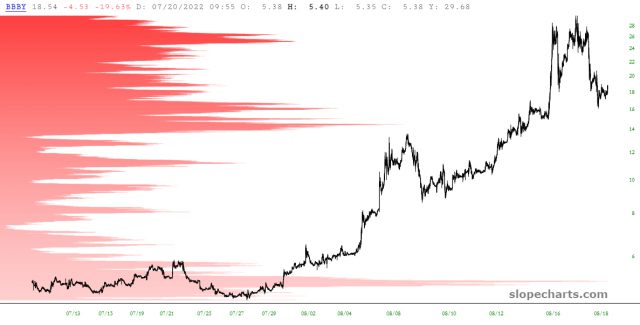
As another example, here is the former “meme” stock Bed Bath & Beyond during a frenzied period in which it was one of the most popular stocks traded. You can see how more recently activity is displayed with a darker color, whereas older data (in this case, a few trading days prior) is shown with a lighter shade of red.
You also have the ability to ability to adjust the Bar Width:
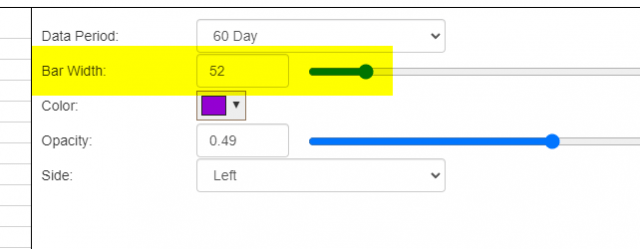
By default, when volume profile is shown, it presents the most finely-grained representation it can of the volume data based on price levels.
If you would prefer a cruder representation of these bars, you can slide the Bar Width bar to increase the range of price levels represented by each bar. The term “cruder representation” should not be confused with “inferior“, because it is often better to see data represented in a consolidated fashion to get a better idea as to where important levels are, much the same way that traders use monthly or quarterly bar charts even when daily charts are available.