Slope of Hope Blog Posts
Slope initially began as a blog, so this is where most of the website’s content resides. Here we have tens of thousands of posts dating back over a decade. These are listed in reverse chronological order. Click on any category icon below to see posts tagged with that particular subject, or click on a word in the category cloud on the right side of the screen for more specific choices.
This Week’s Tsunami
Candlesticks & Levels (by Xerxes)
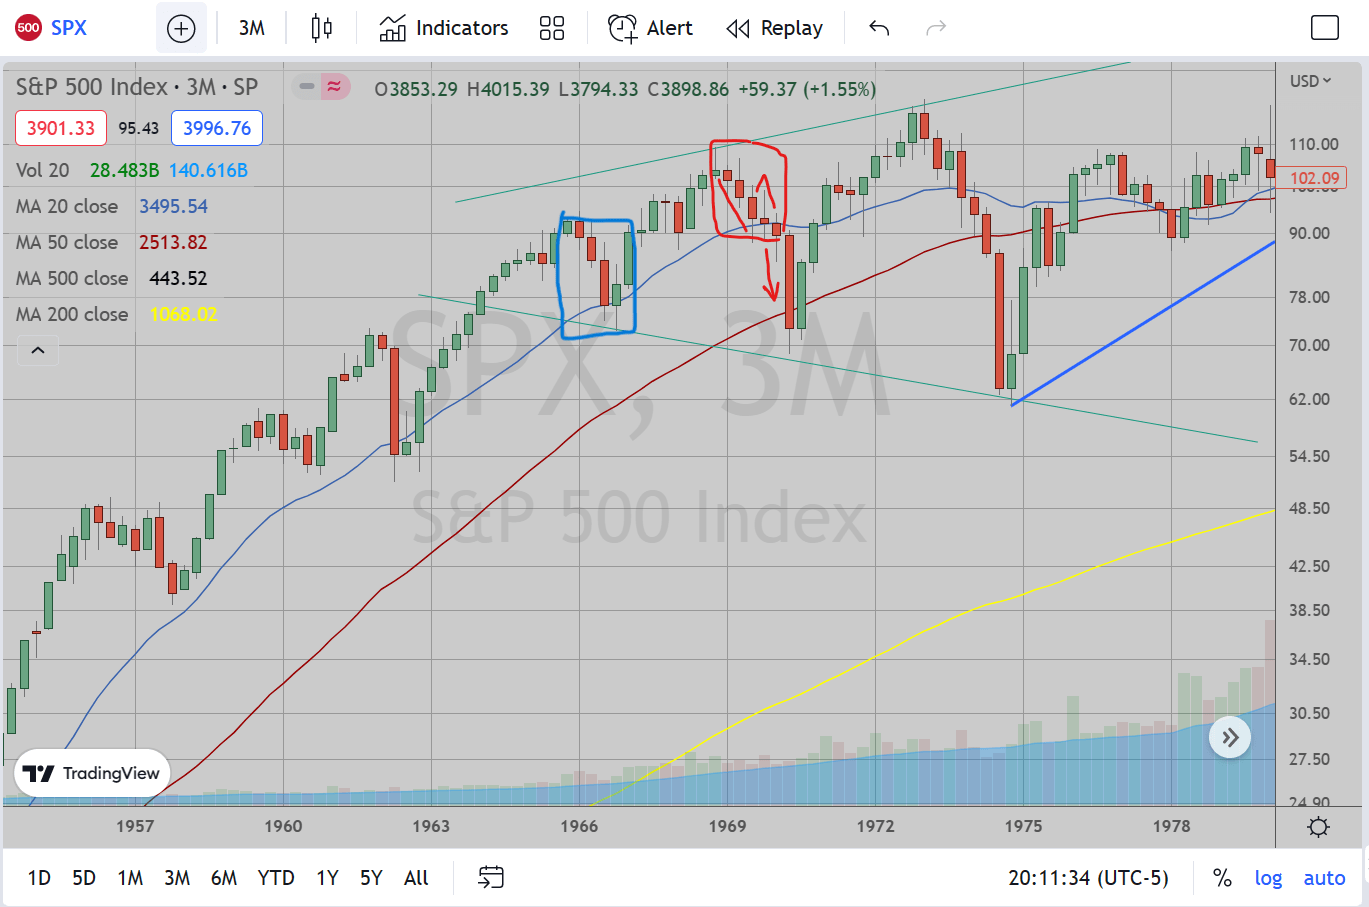
I’m watching a few different timeframes to get ideas from a technical perspective in SPX. I’m sure everyone in the past two weeks has been hearing about how “After a large down year, the S&P 500 returns +%”, blah blah blah. While I understand and occasionally do studies like that, I think calendar year is simply too long of a timeframe. It doesn’t capture the length or nuance of the bear markets to determine the next short-term move as we only have about 70 (?) reliable yearly candlesticks to base any analysis on, which doesn’t seem like a lot at all. I prefer to use quarterly as the longest time frame for my candlesticks.
Netflix Expands Its Moat
When Signals Align
Netflix Inc. (NFLX) is another instance where signals from Portfolio Armor and LikeFolio have aligned. At the end of October, the stock hit our top names, as I noted at the time,
Mr. Wizard’s Epic Post (3 of 3)
You can click here for Part 1 and here for Part 2.
Can Caped Crusaders rescue us?
Another valuation method is the Shiller CAPE 10, which stands for Cyclically Adjusted PE Ratio, with a period of 10 years. This metric is cited quite often when claims are made the market is overvalued.
Resources:
http://www.econ.yale.edu/~shiller/data.htm
https://www.multpl.com/shiller-pe
Shiller’s thesis (literally) was that averaging earnings over a period of several years created a valuation measure that could be used to predict future returns, since the longer period tended to smooth out the ups and downs of the economy and give a more accurate picture of corporate fundamentals. The same data we used in the trendline construction can be used to plot the Shiller CAPE.
(more…)