
I’m watching a few different timeframes to get ideas from a technical perspective in SPX. I’m sure everyone in the past two weeks has been hearing about how “After a large down year, the S&P 500 returns +%”, blah blah blah. While I understand and occasionally do studies like that, I think calendar year is simply too long of a timeframe. It doesn’t capture the length or nuance of the bear markets to determine the next short-term move as we only have about 70 (?) reliable yearly candlesticks to base any analysis on, which doesn’t seem like a lot at all. I prefer to use quarterly as the longest time frame for my candlesticks.
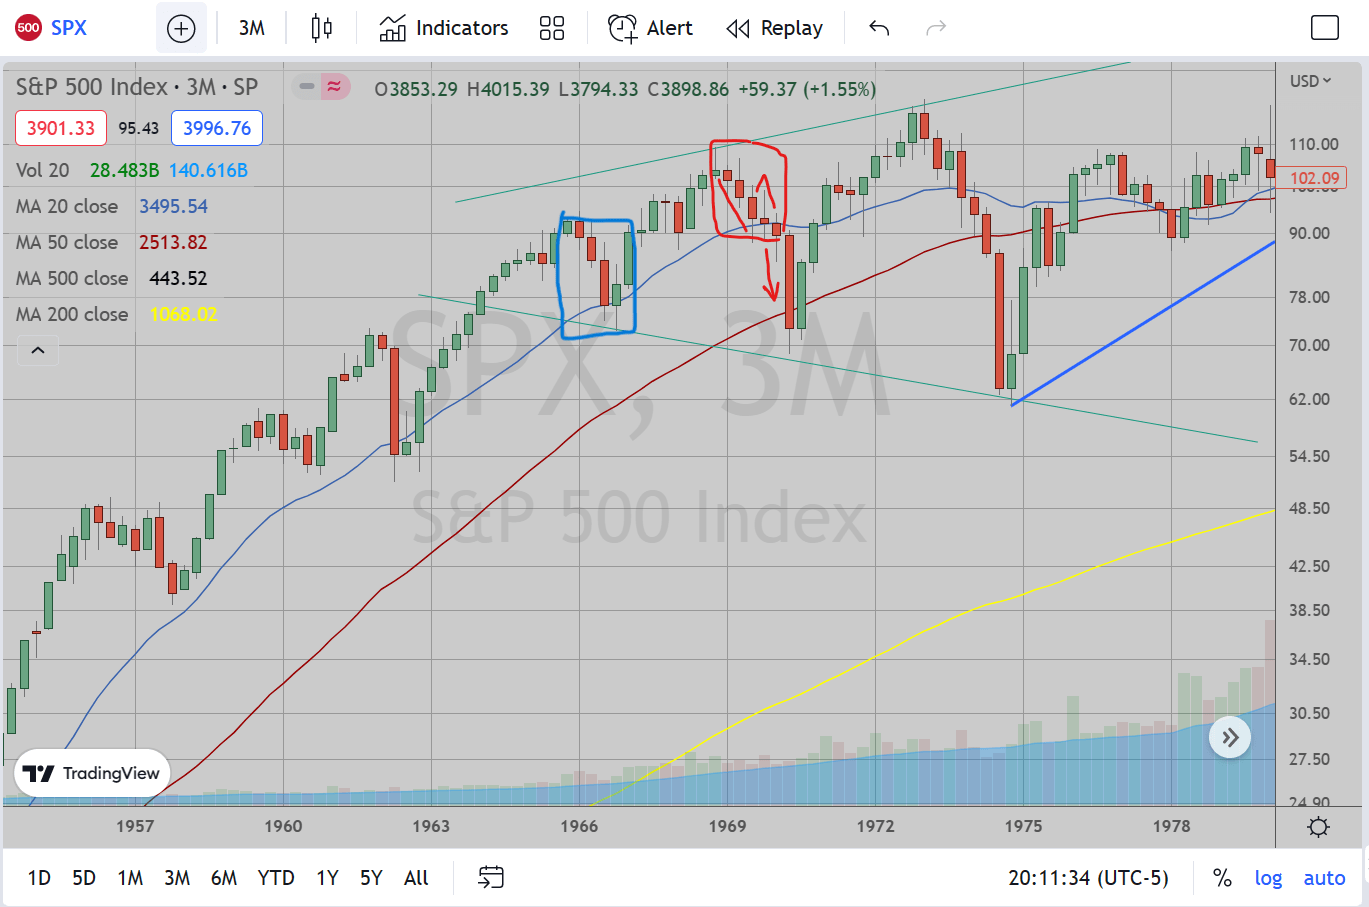
These 3 charts are quarterly candlesticks which I have circled as being quite important as they reflect a pattern in which we are smack dab in the middle. The pattern I am seeing is three quarterly red candles after a market peak, followed by a 4th candle green (bounce attempt), then turn back down in 5th candle to fail and fail spectacularly.
The first chart shows the 1969 bear market in the red marked box. This didn’t actually have a green candle, but you can see the wick in which the 4th candle attempted to bounce and catch itself, then the 5th candle turned right back down hard. You will also notice the 1965 bear market in the blue marked box. I wanted to make sure to note this as this was the only example I could find where this pattern fails.
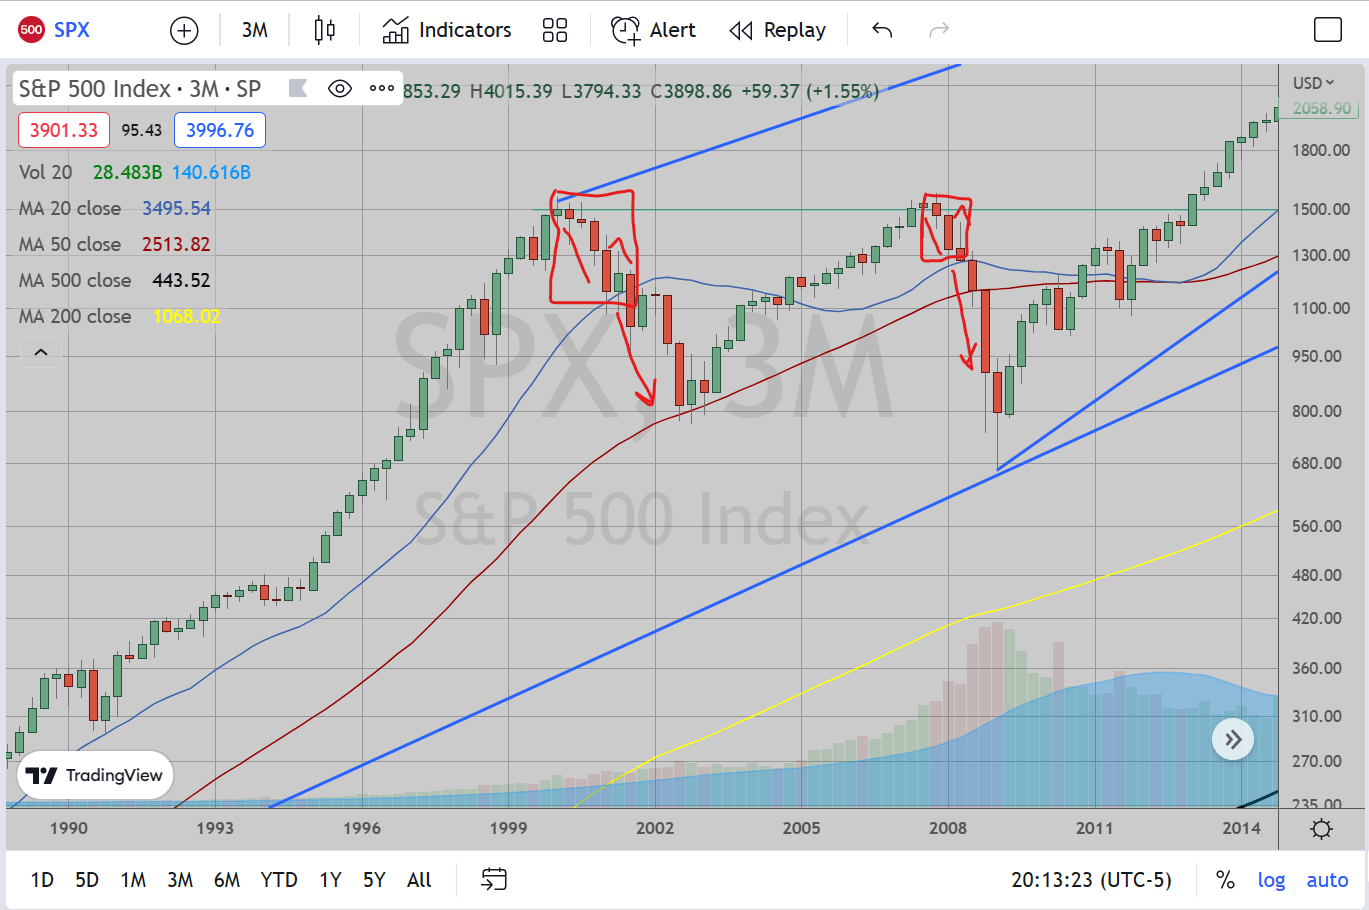
The second chart shows the 2001 and 2008 bear markets. The 2001 bear market had a steady rollover from the peak, but sure enough there was the green bounce attempt followed by the red candle to engulf the previous quarter. The 2008 bear market you will notice did not even manage a real full quarter of bounce attempt, but I did note the very small wick in the 3rd quarter candlestick to attempt to bounce which then led to the most famous recent bear market.
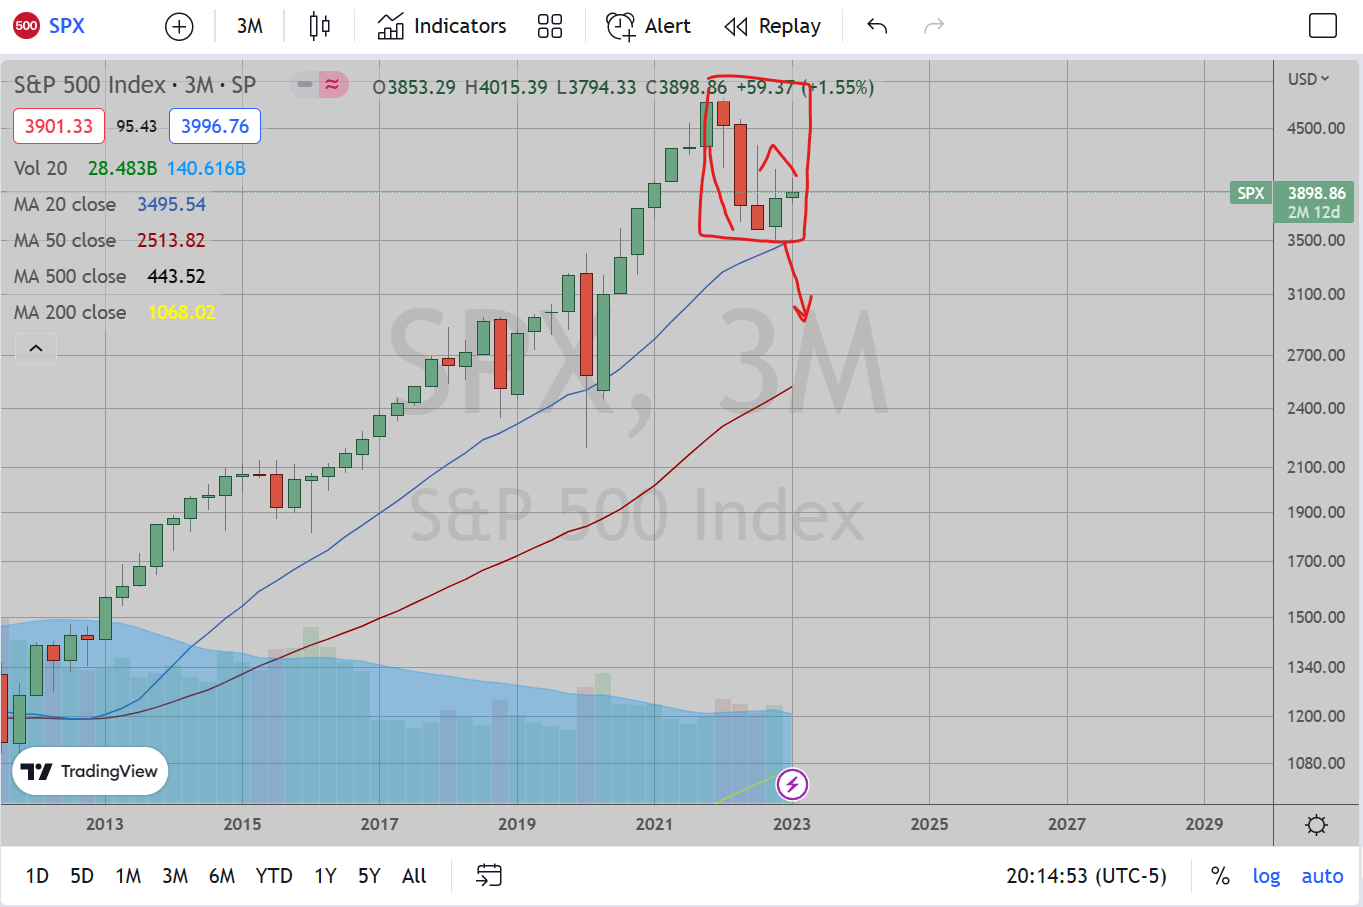
The third chart shows the current period we are in. We have this three red quarters in a row after a market peak, green candlestick bounce attempt, after which I am enthusiastically cheering this pattern to play out and form a large red candlestick.
The only problem with using these quarterly charts is that there is a LOT of time for this quarterly candle to play out, specifically about two and a half months before this quarter ends. But in terms of levels to watch off these charts, the 4th quarter 2022 candlestick closed at 3844, so expect some action/bounce attempts at that spot.
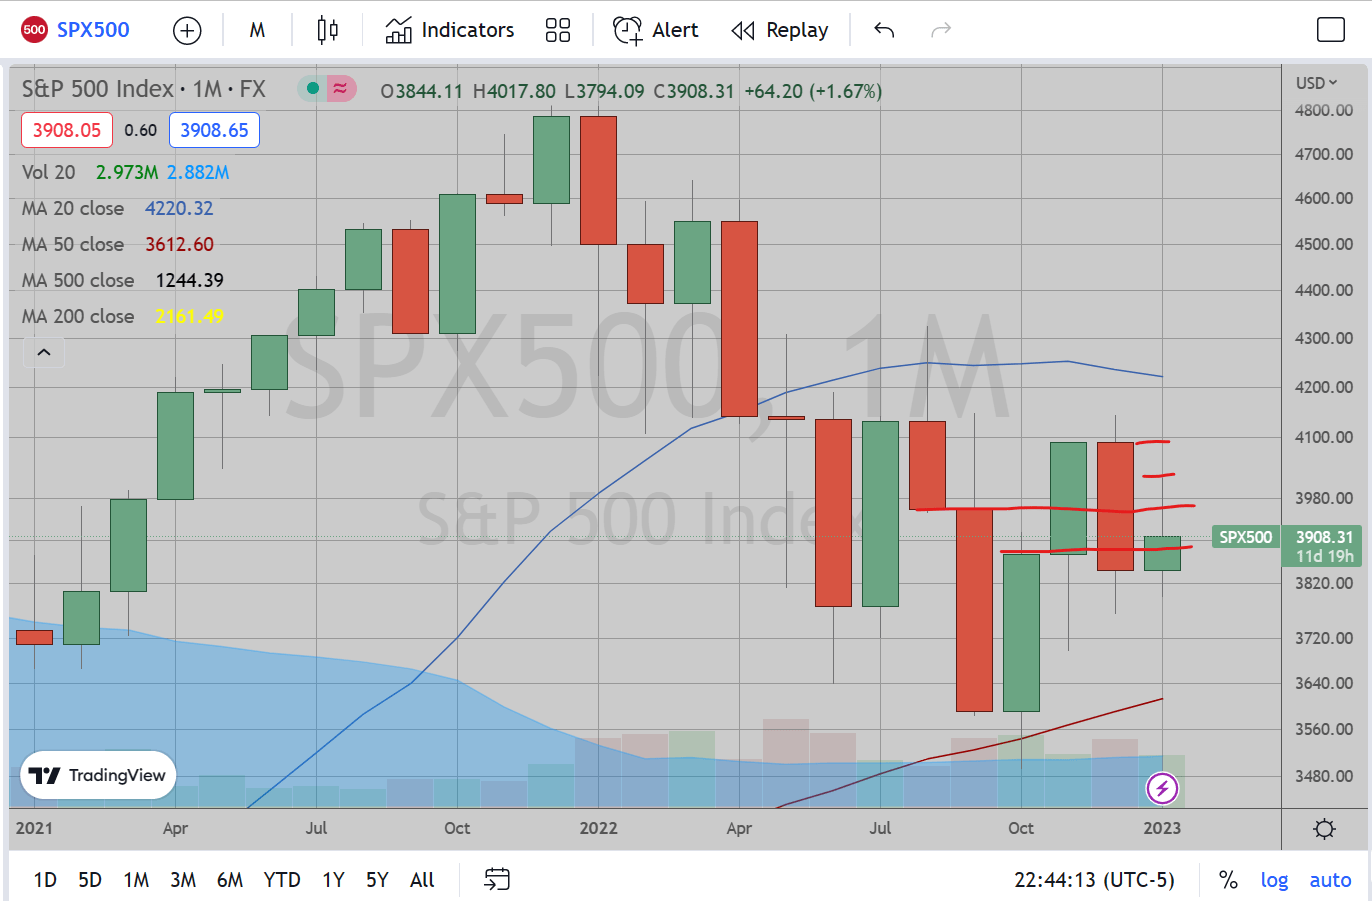
On the monthly chart, other levels I am watching is based on month open/close/high/lows. Short term moves often relate to these pivot areas, so I am watching the October Close/November Open at 3874, the August close at 3960, the most recent highs from last week at 4017, and finally last month’s open near 4100.
We’ve got 2 more months after this one to determine how the next quarterly candle shapes up, but I think a close anywhere near here would open the path for a shot down in February/March. The rejection from 4000 looks pretty strong (as long as we close the month down here
