
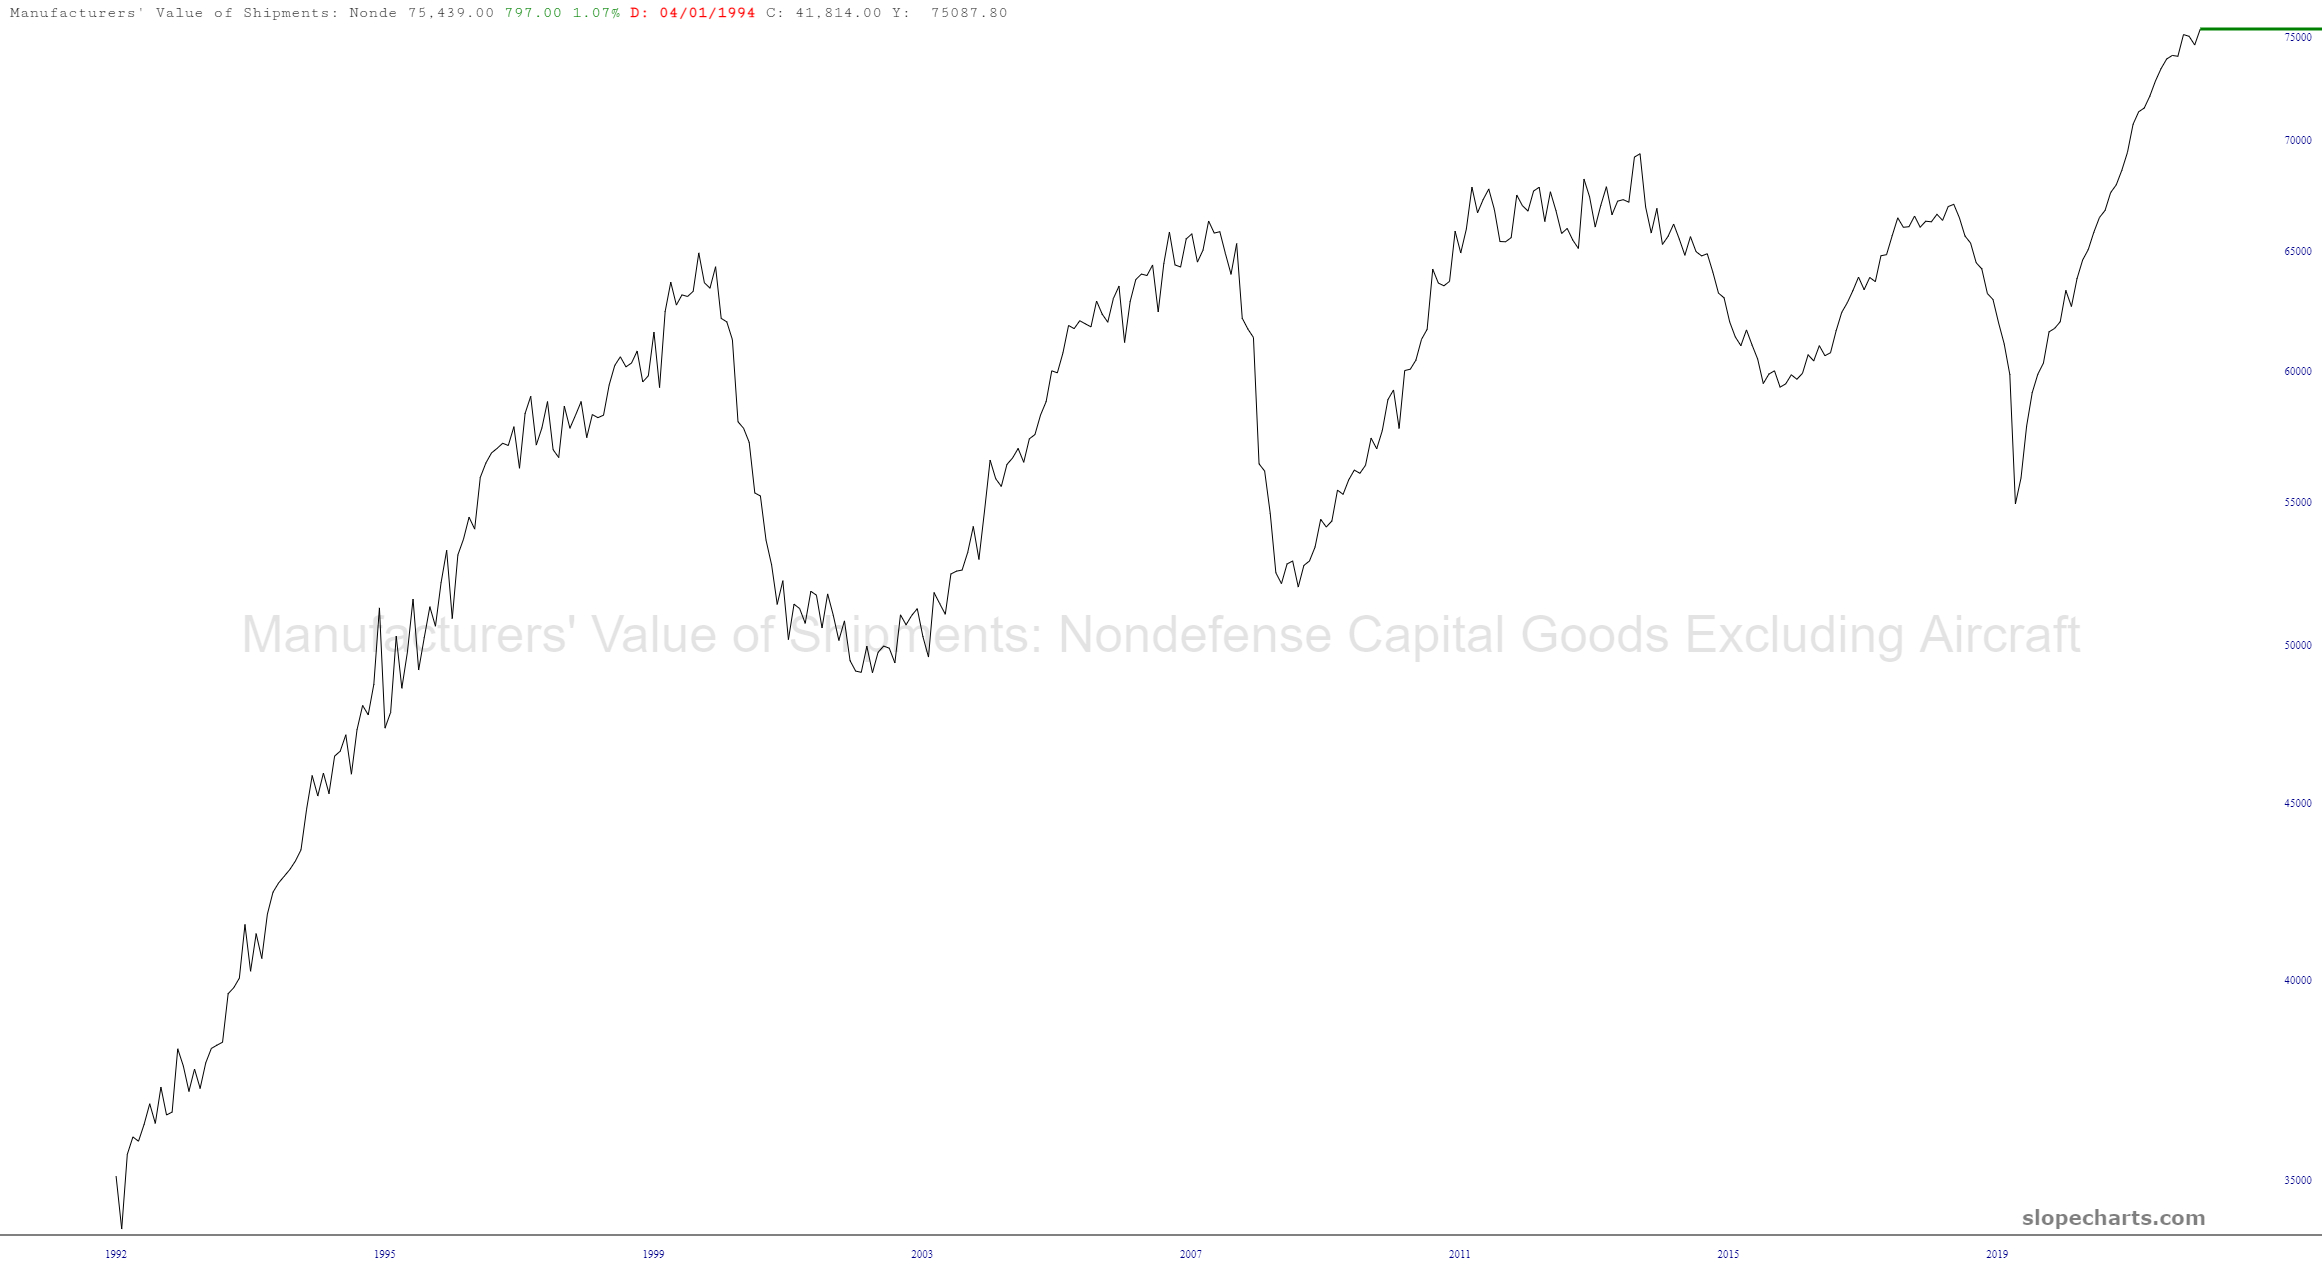
I wanted to share a few relatively up-to-date long-term economics charts. First is the value of manufactured goods. Looks pretty cyclic, doesn’t it? Also looks like a major peak, doesn’t it? Yeah, that’s what I see too.
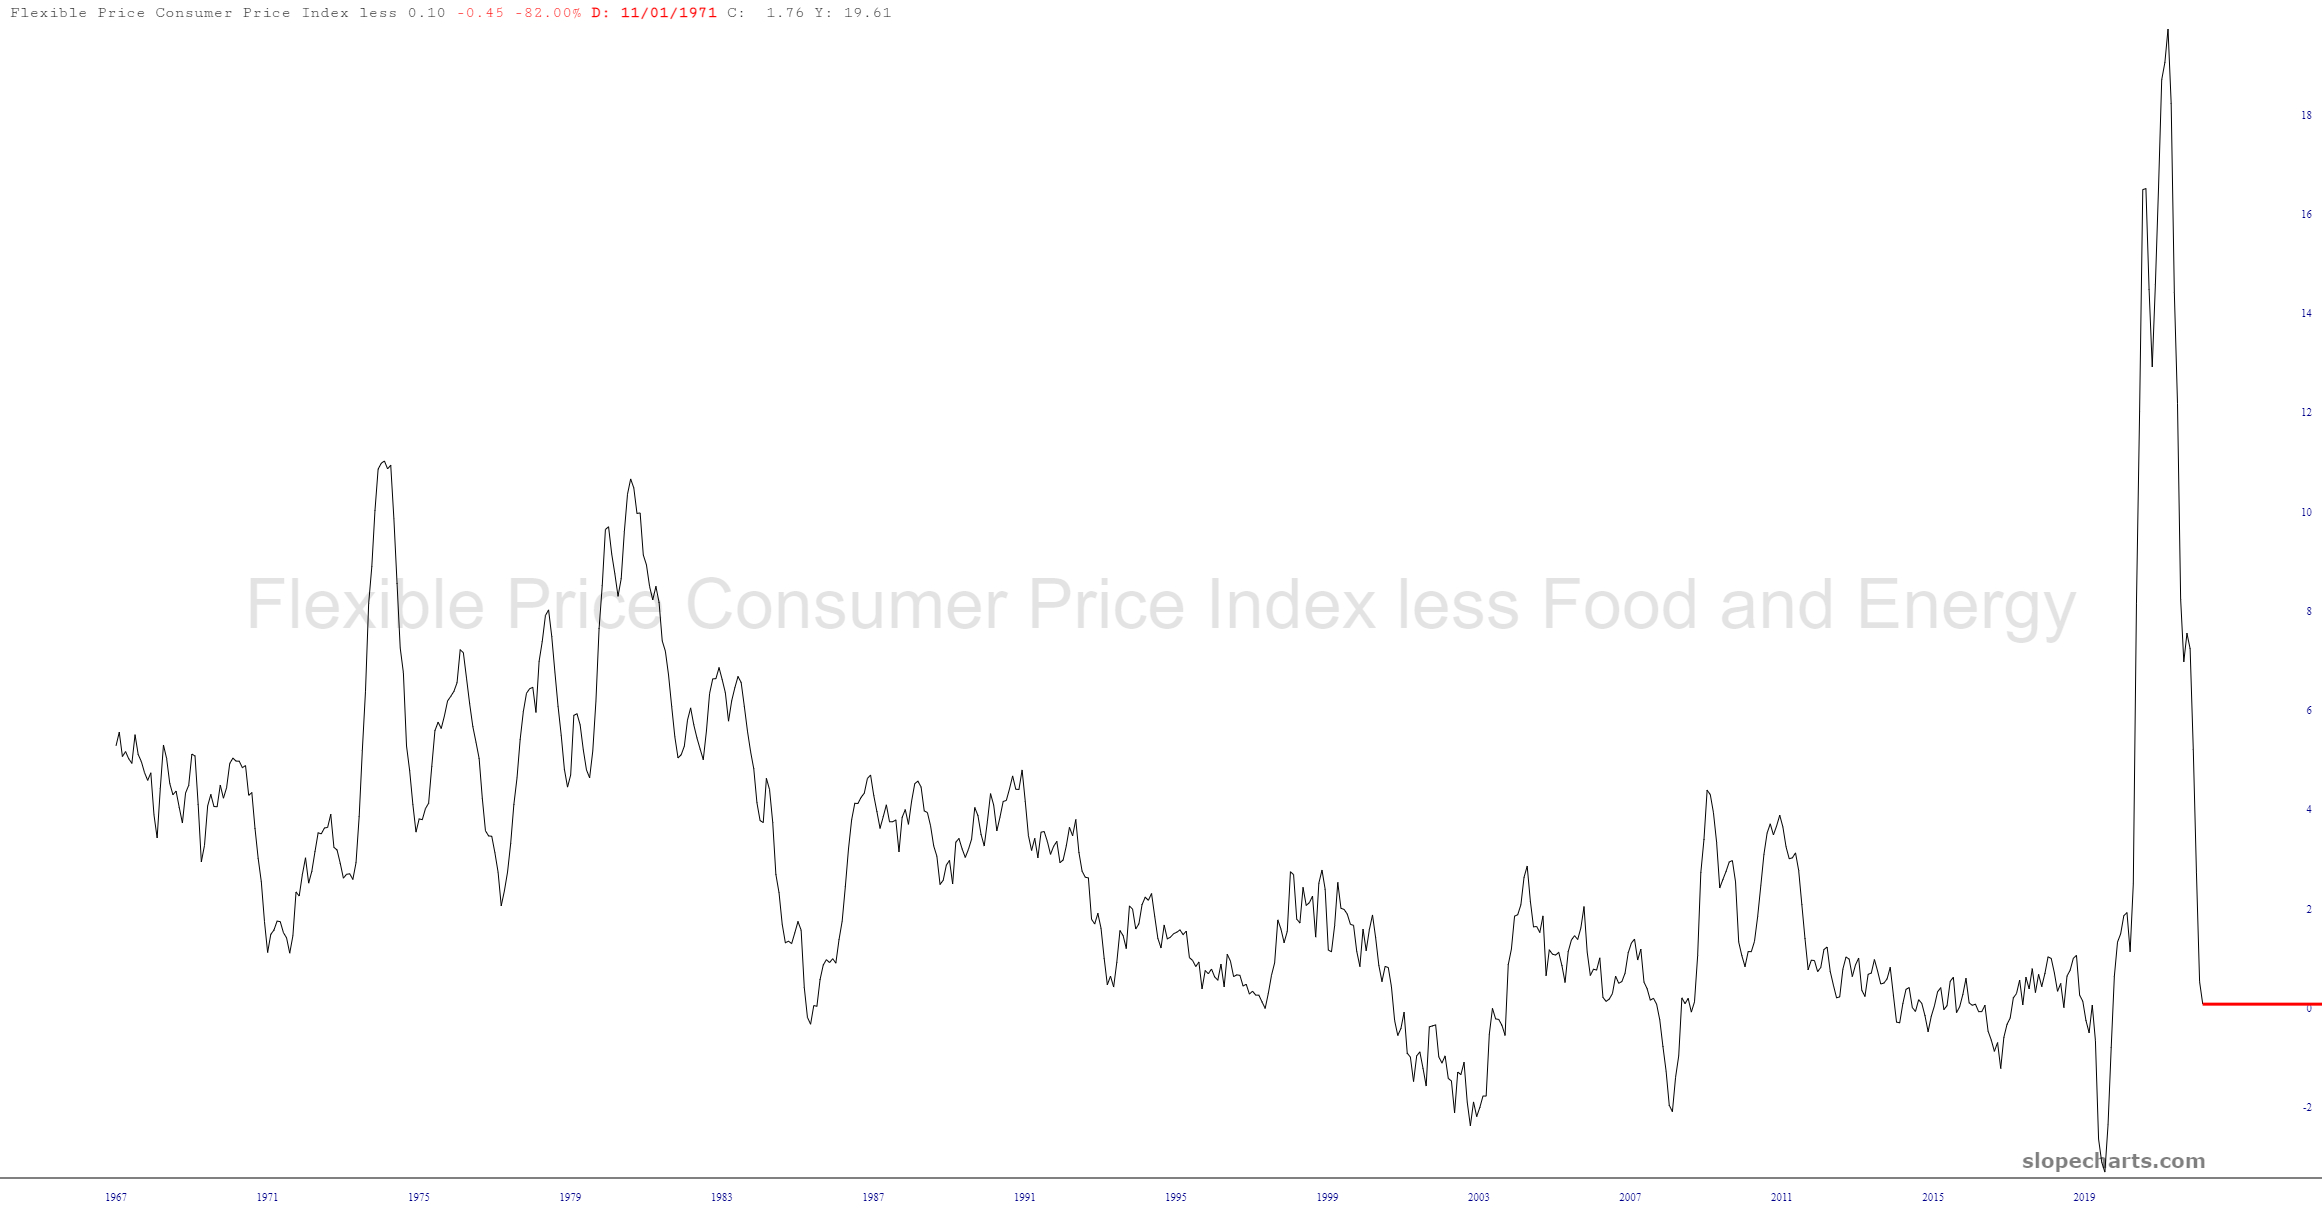
Here we can see how quickly prices have “dis-inflated” in recent months.
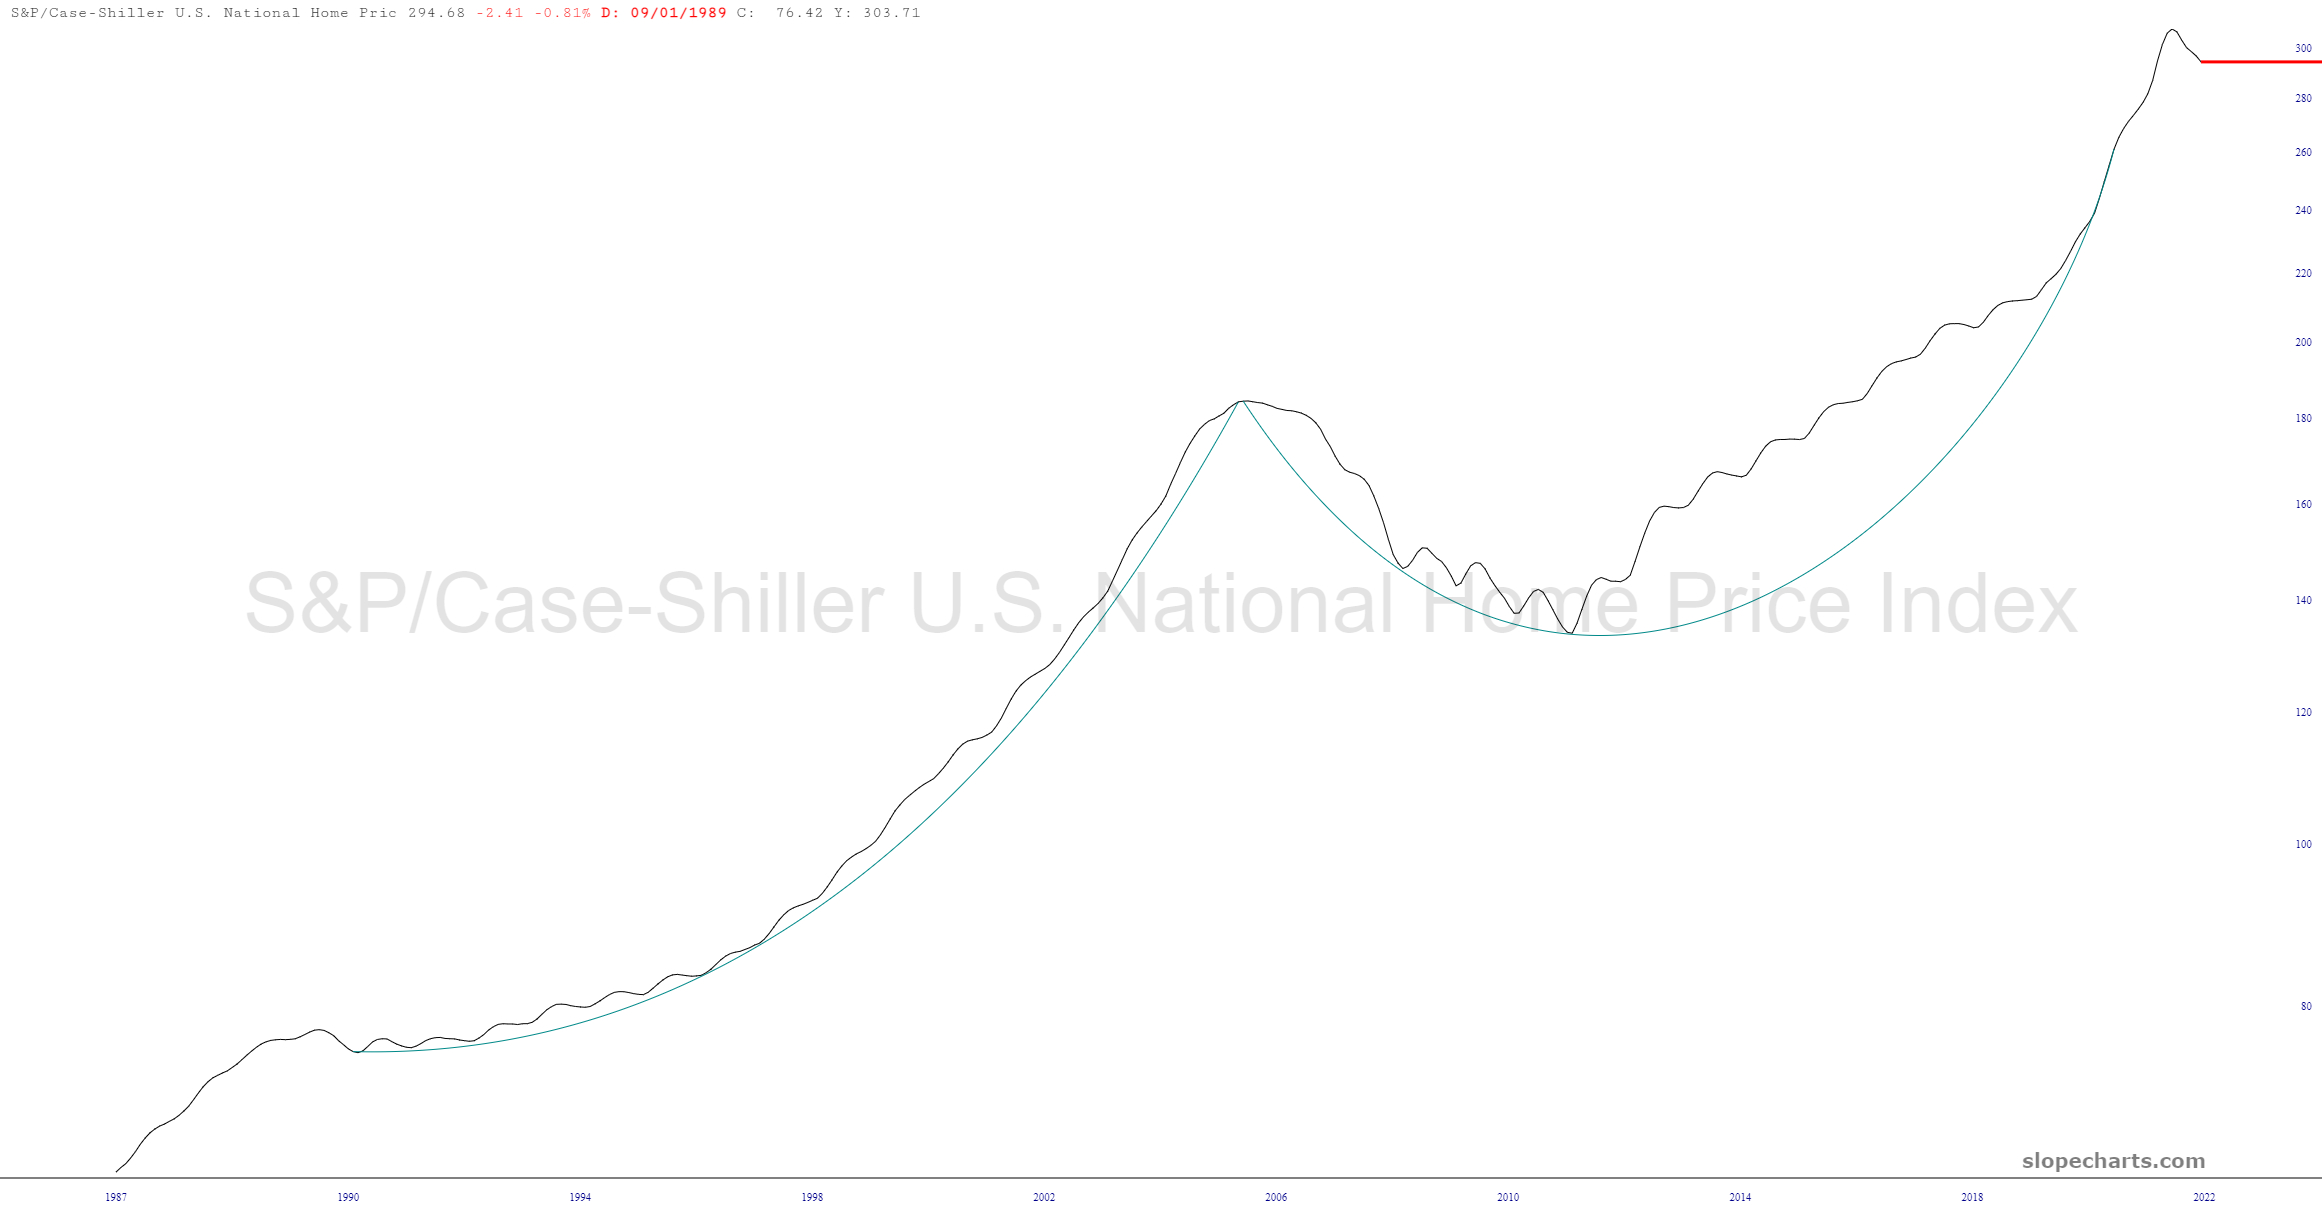
This one is especially cool, which shows the average price of houses in the U.S. This is the second time a major inflection point has taken place. Want to know the first time? The summer of 2006. Gosh, I think something happened soon after that.
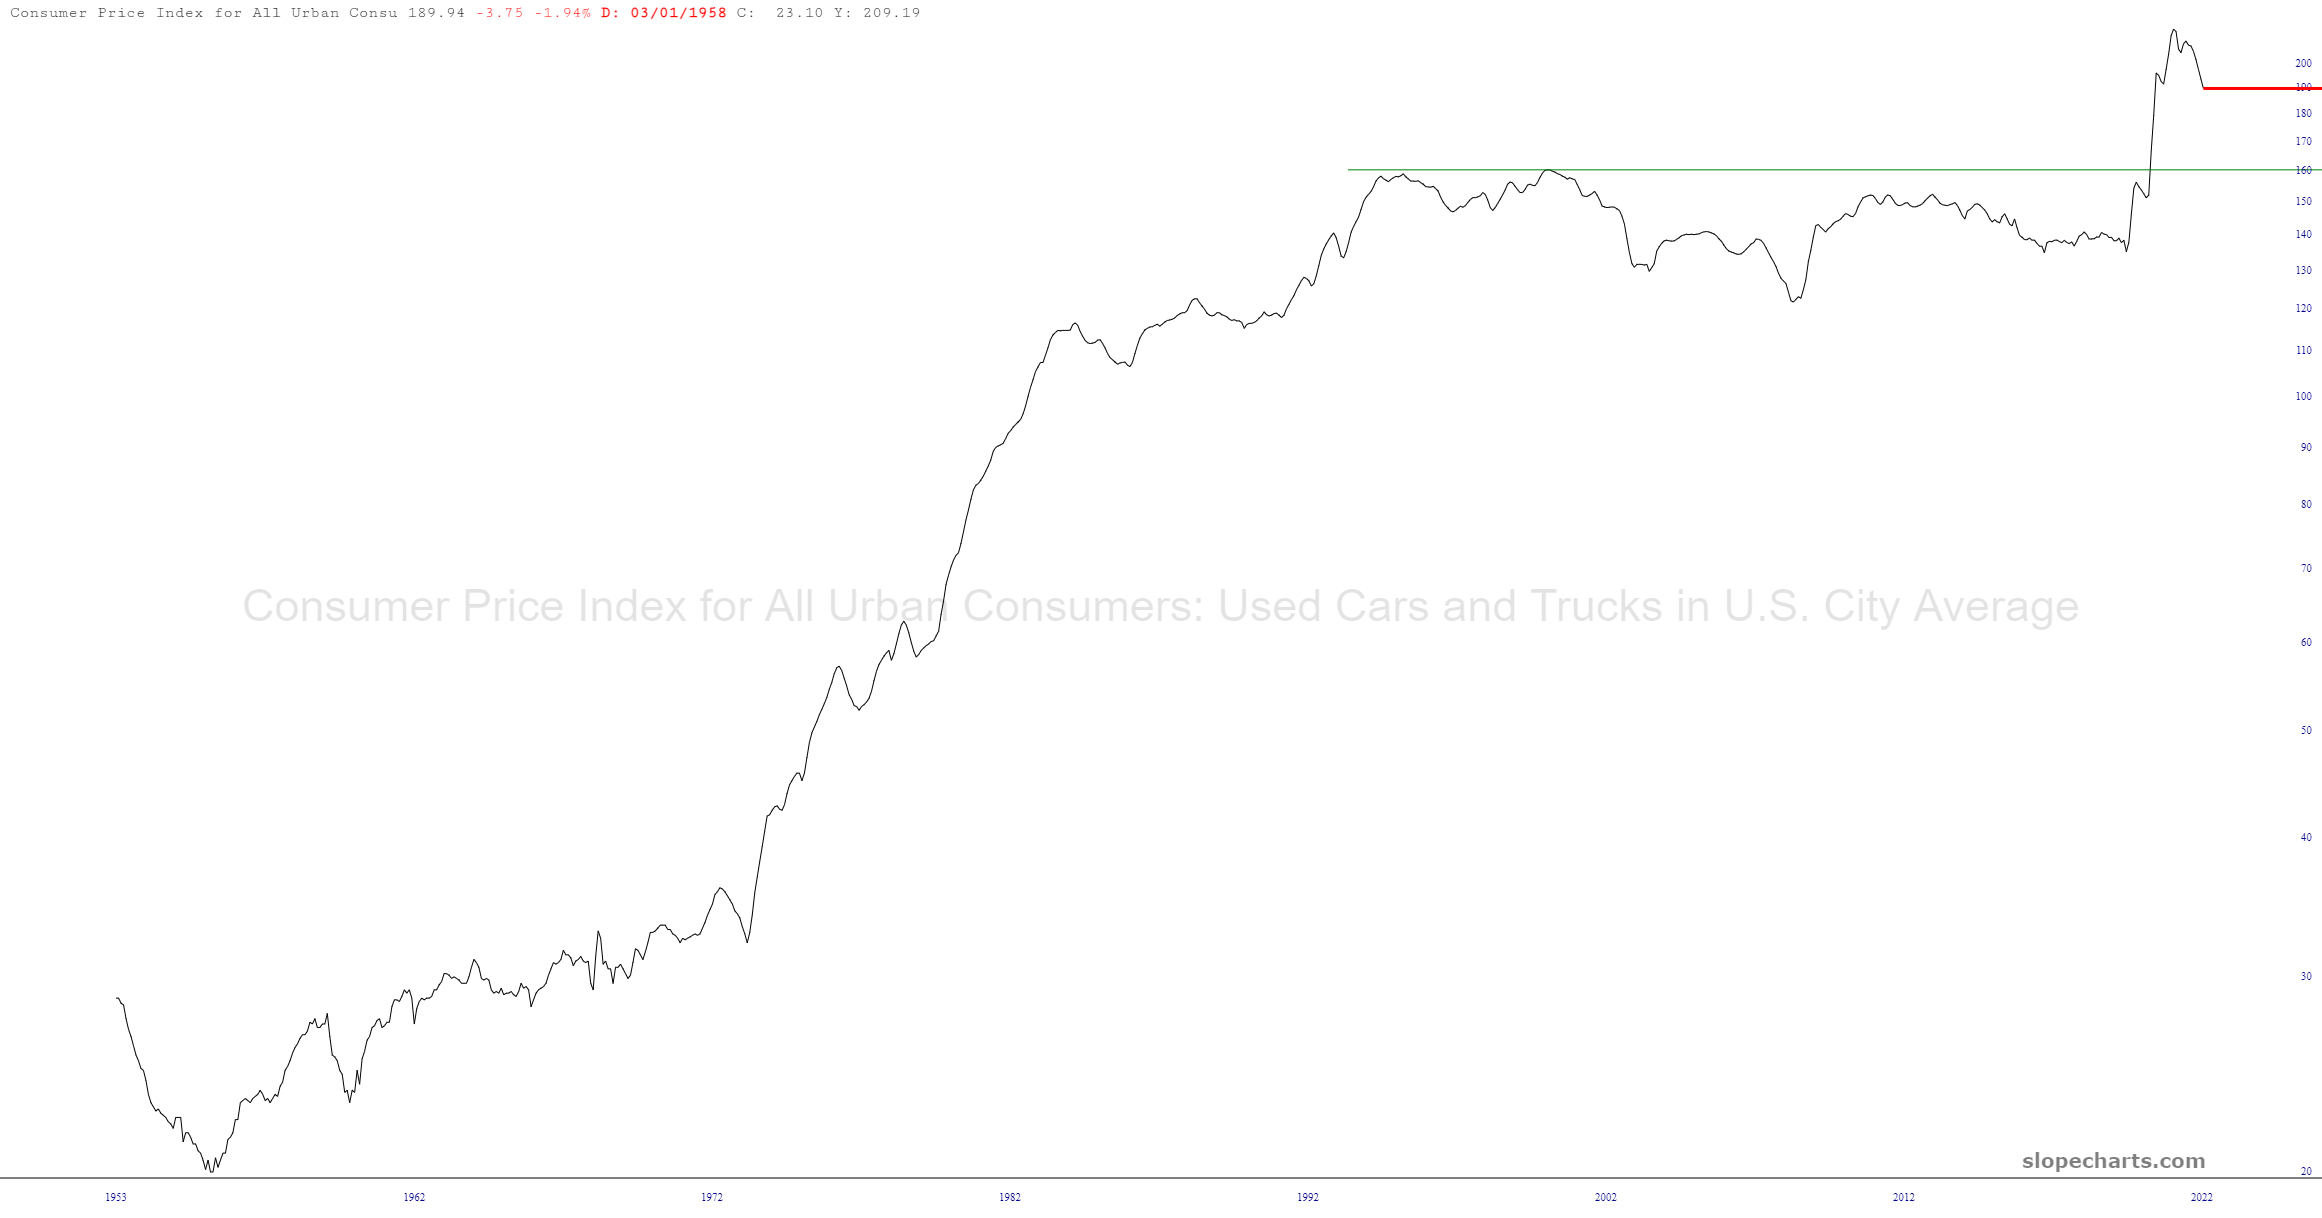
Oh, back to inflation, here we see the used cars & trucks CPI (very niche, I realize) which ripped higher and is now reversing.
Lastly, here are the new housing units under construction, which has roared higher for years. Once again, this looks awfully toppy to my eyes. In other words: unsustainable.

