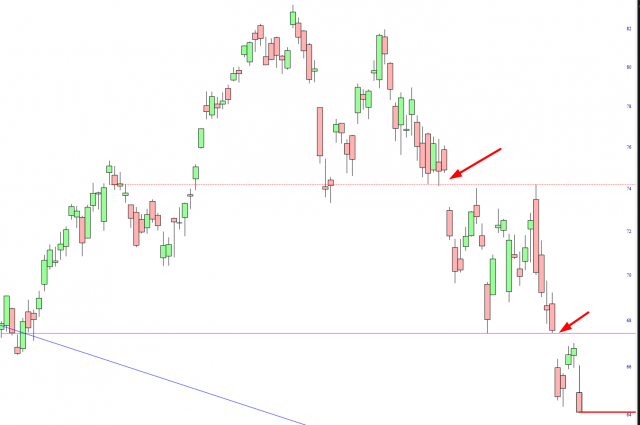
Crude oil reached its price peak nine three months ago (unlike, oh, let’s just say, stocks) and have been pounding down steadily ever since. Looking at USO, you can see how picture-perfect the price gap has been, since, twice, the prices fought back to fill the gap but failed to do so, only to continue lower.

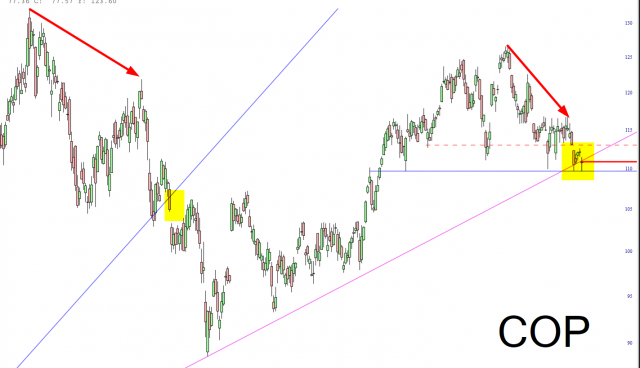
Taking a look at Conoco Phillips, I think we’re at a “You Are Here” kind of moment, if you observe the red arrows and tinted zone (each of which has a trend break).

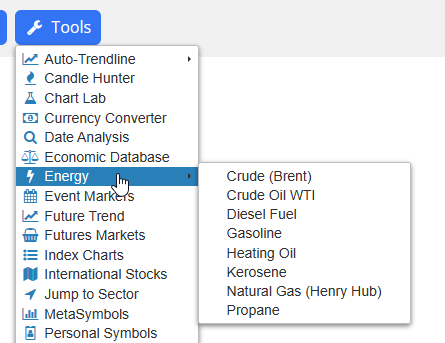
Incidentally, SlopeCharts has a special Energy menu which gives everyone access to relevant data.


