Since there’s not a tremendous amount to say about a equity futures market that is up 0.2%, let’s turn our attention to something that’s actually moving, which is crude oil. For perspective, here is the weekly chart of this dynamo, with one particular feature being that swan-dive it took off the high board due to Covid (thank you, China!) and its subsequent bounce.
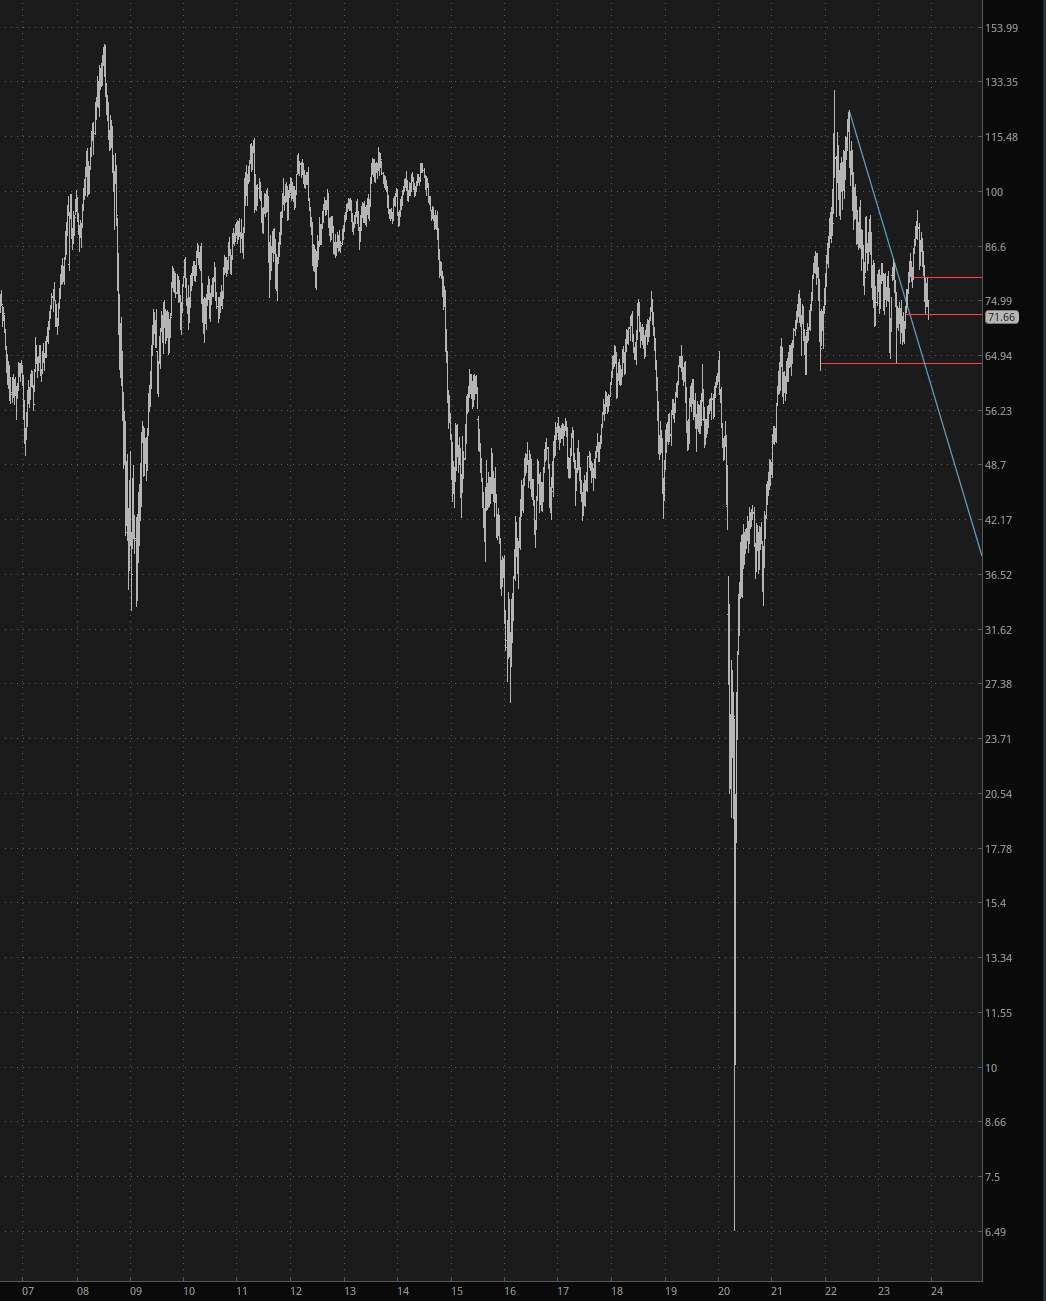
On a daily scale, it’s clear to see a couple of intriguing patterns. One of them, a large (but failed) right triangle top, looked incredibly enticing as of May this year, but by mid-summer, it was wrecked, as it pushed through that blue trendline. The present pattern, which is still cleanly intact, is much smaller.
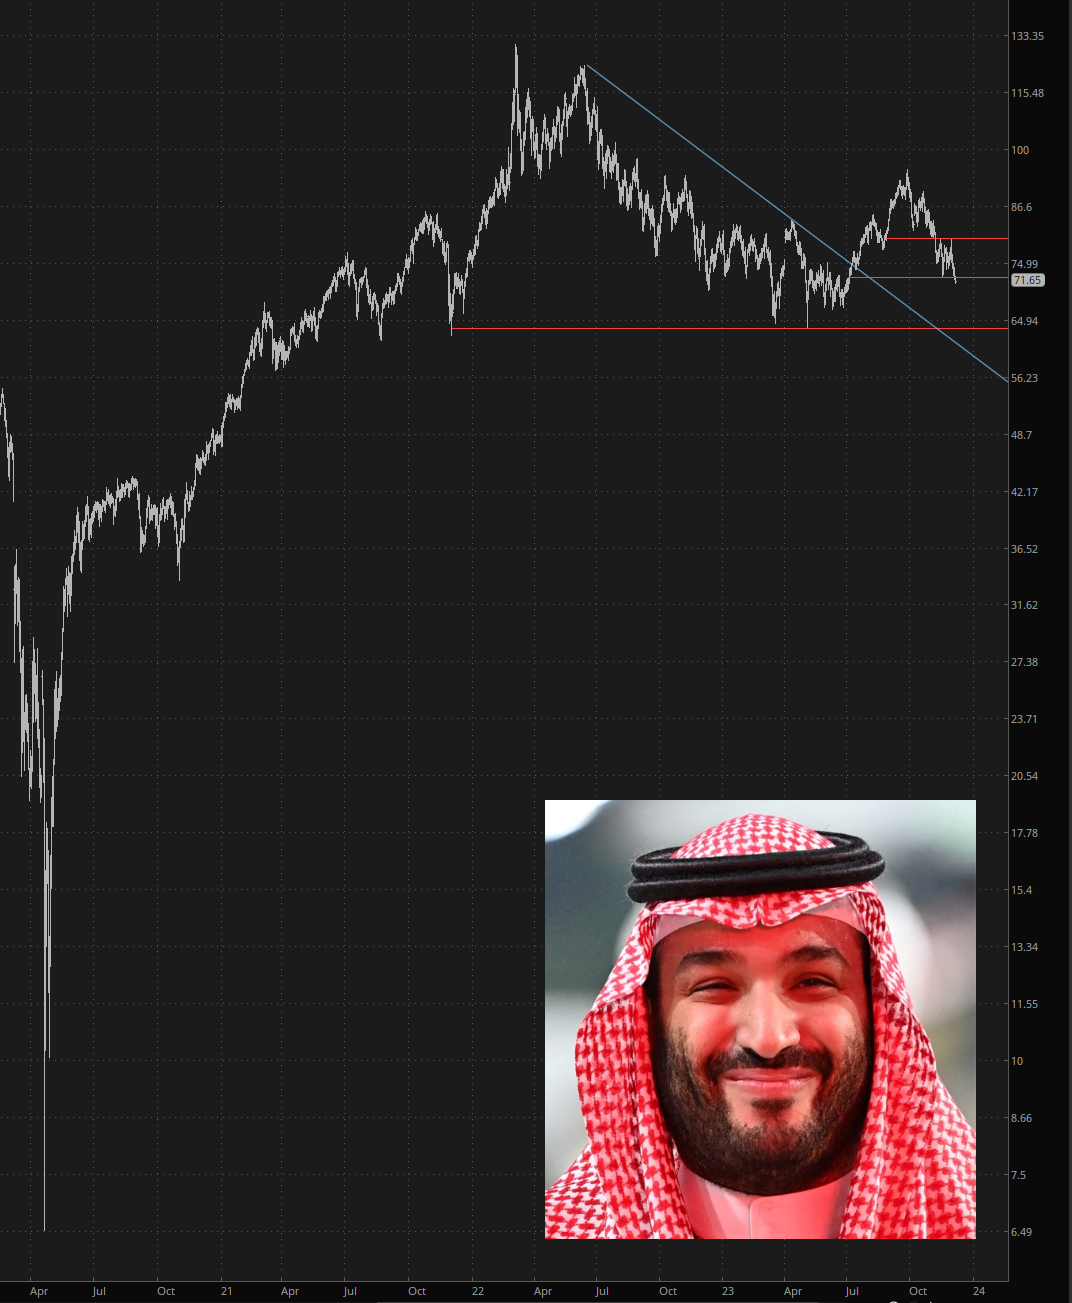
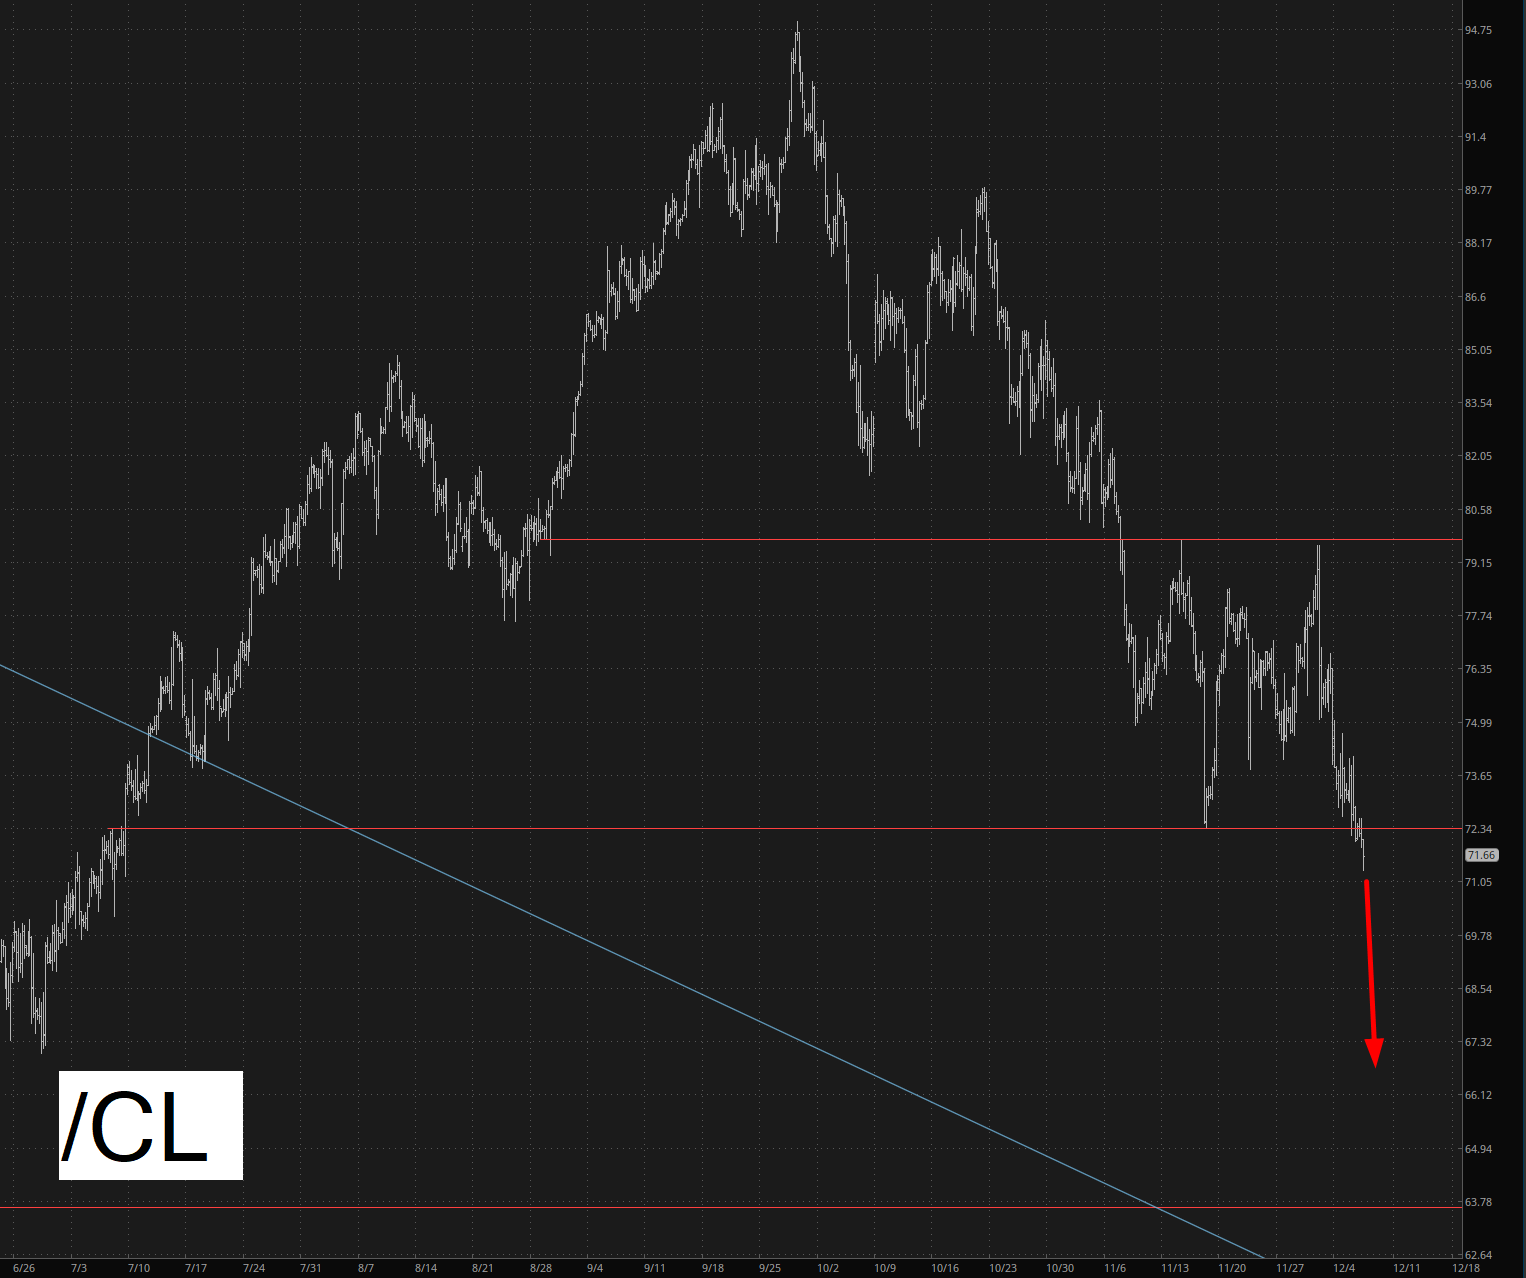
What I am referring to in particular, by way of this 4-hour bar chart, is this pattern. It looks puny on the prior chart, but it actually shows crude oil losing about 25% of its value over the past months, which is no small thing. It’s enough to wipe the smirk off devil-boy’s face (above). My speculation is that we’re heading lower still, in spite of OPEC’s persistent interference with the market. (Indeed, were it not for the cartel, what would oil cost? $30?)
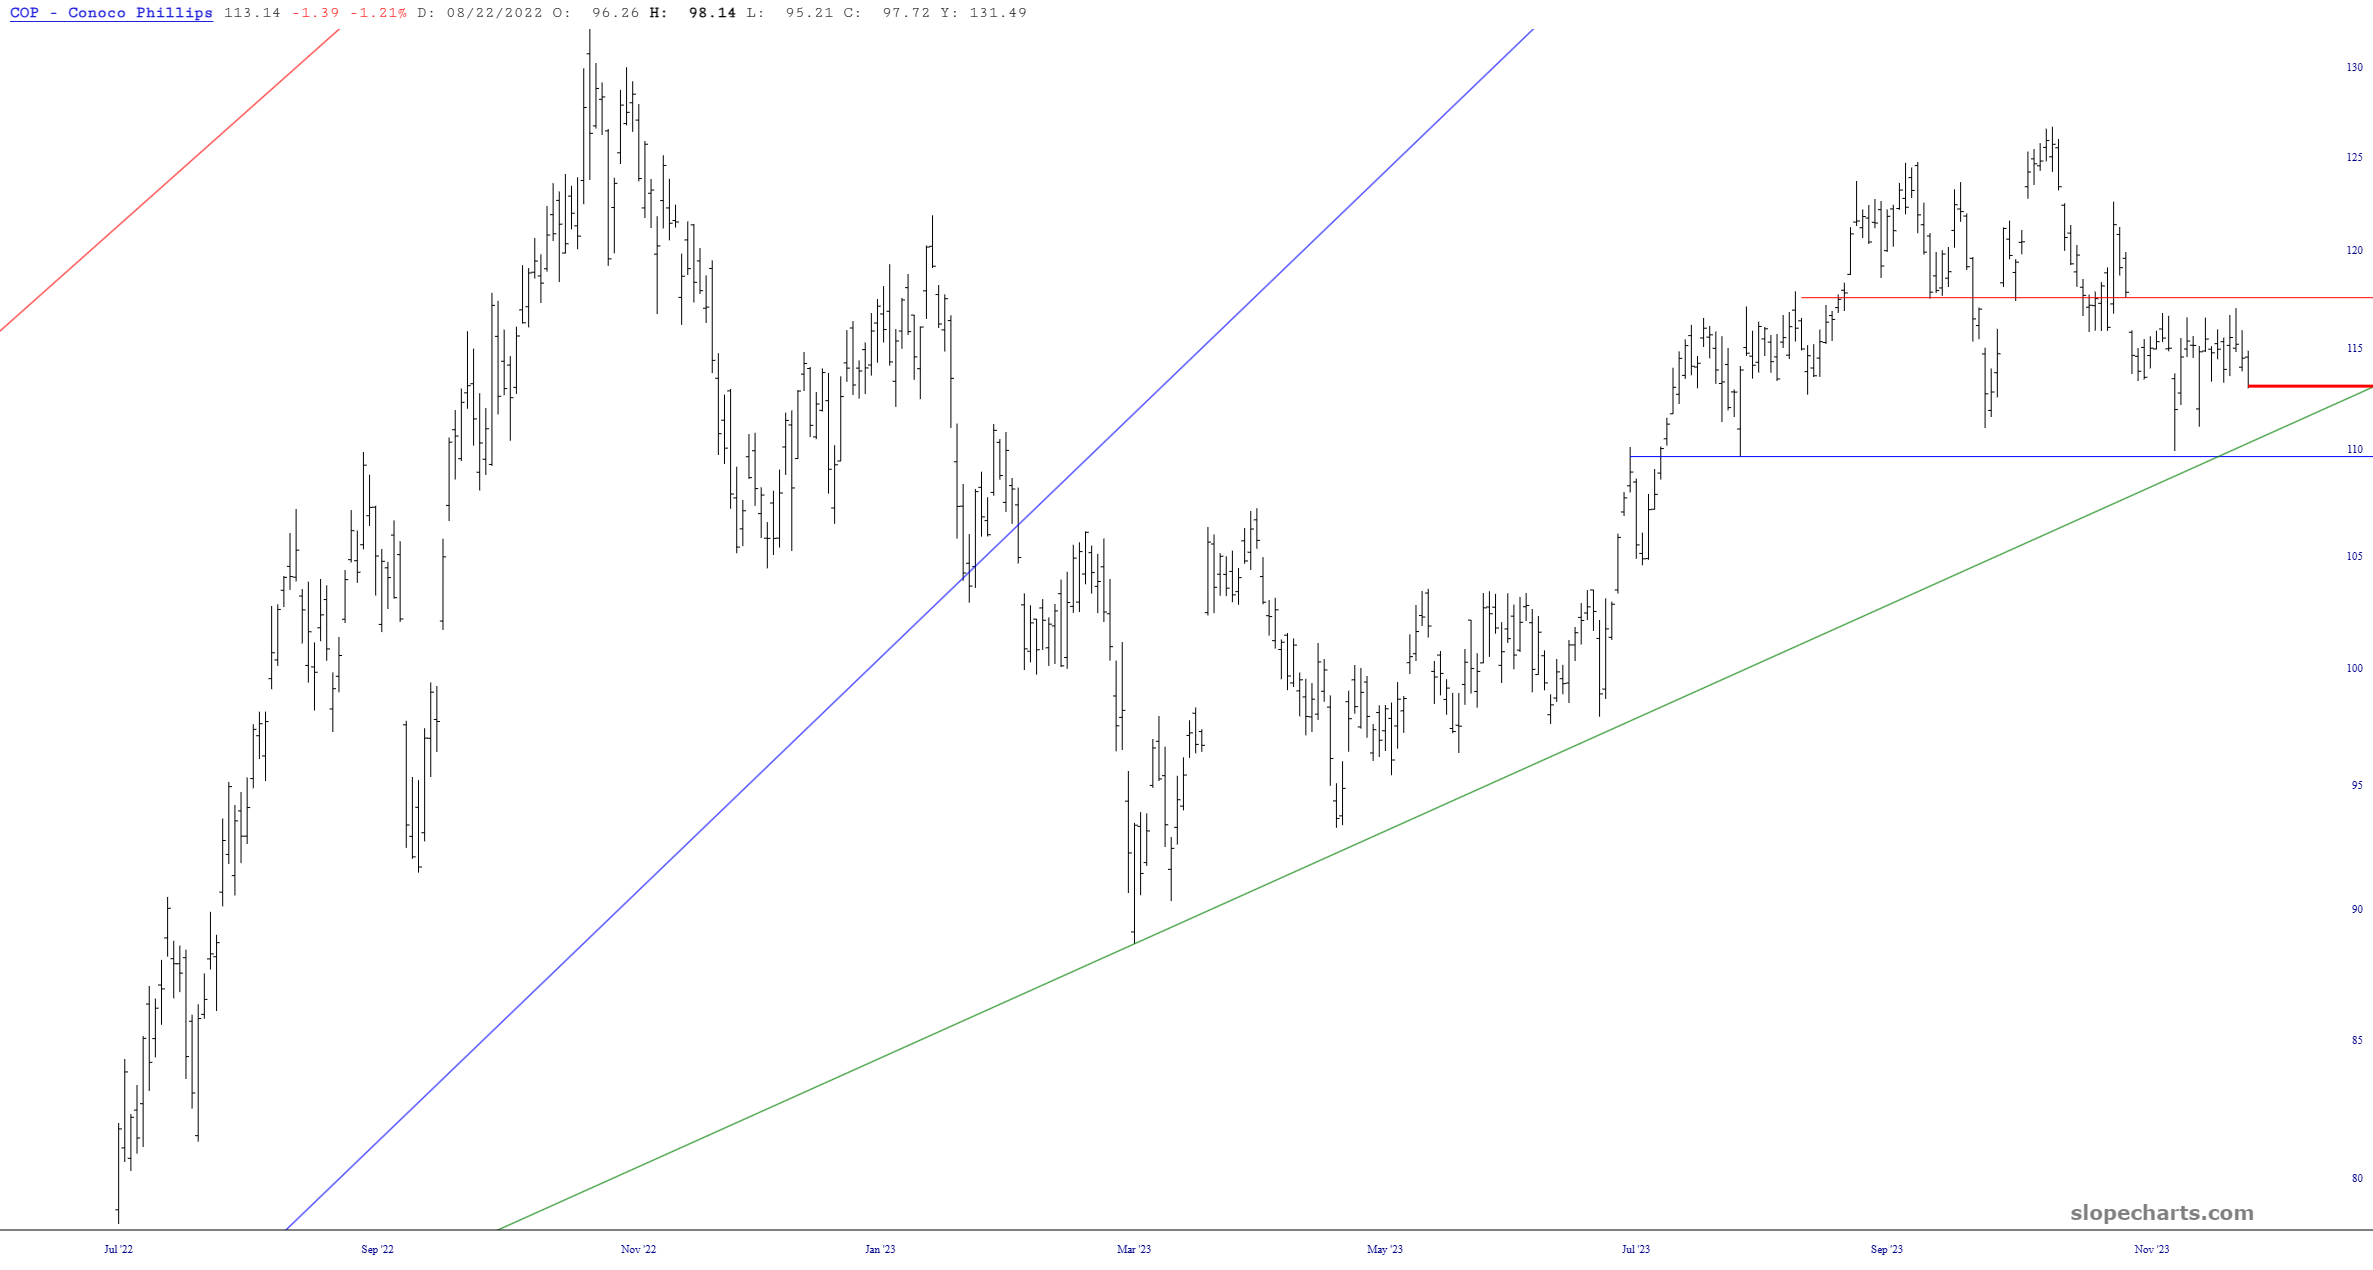
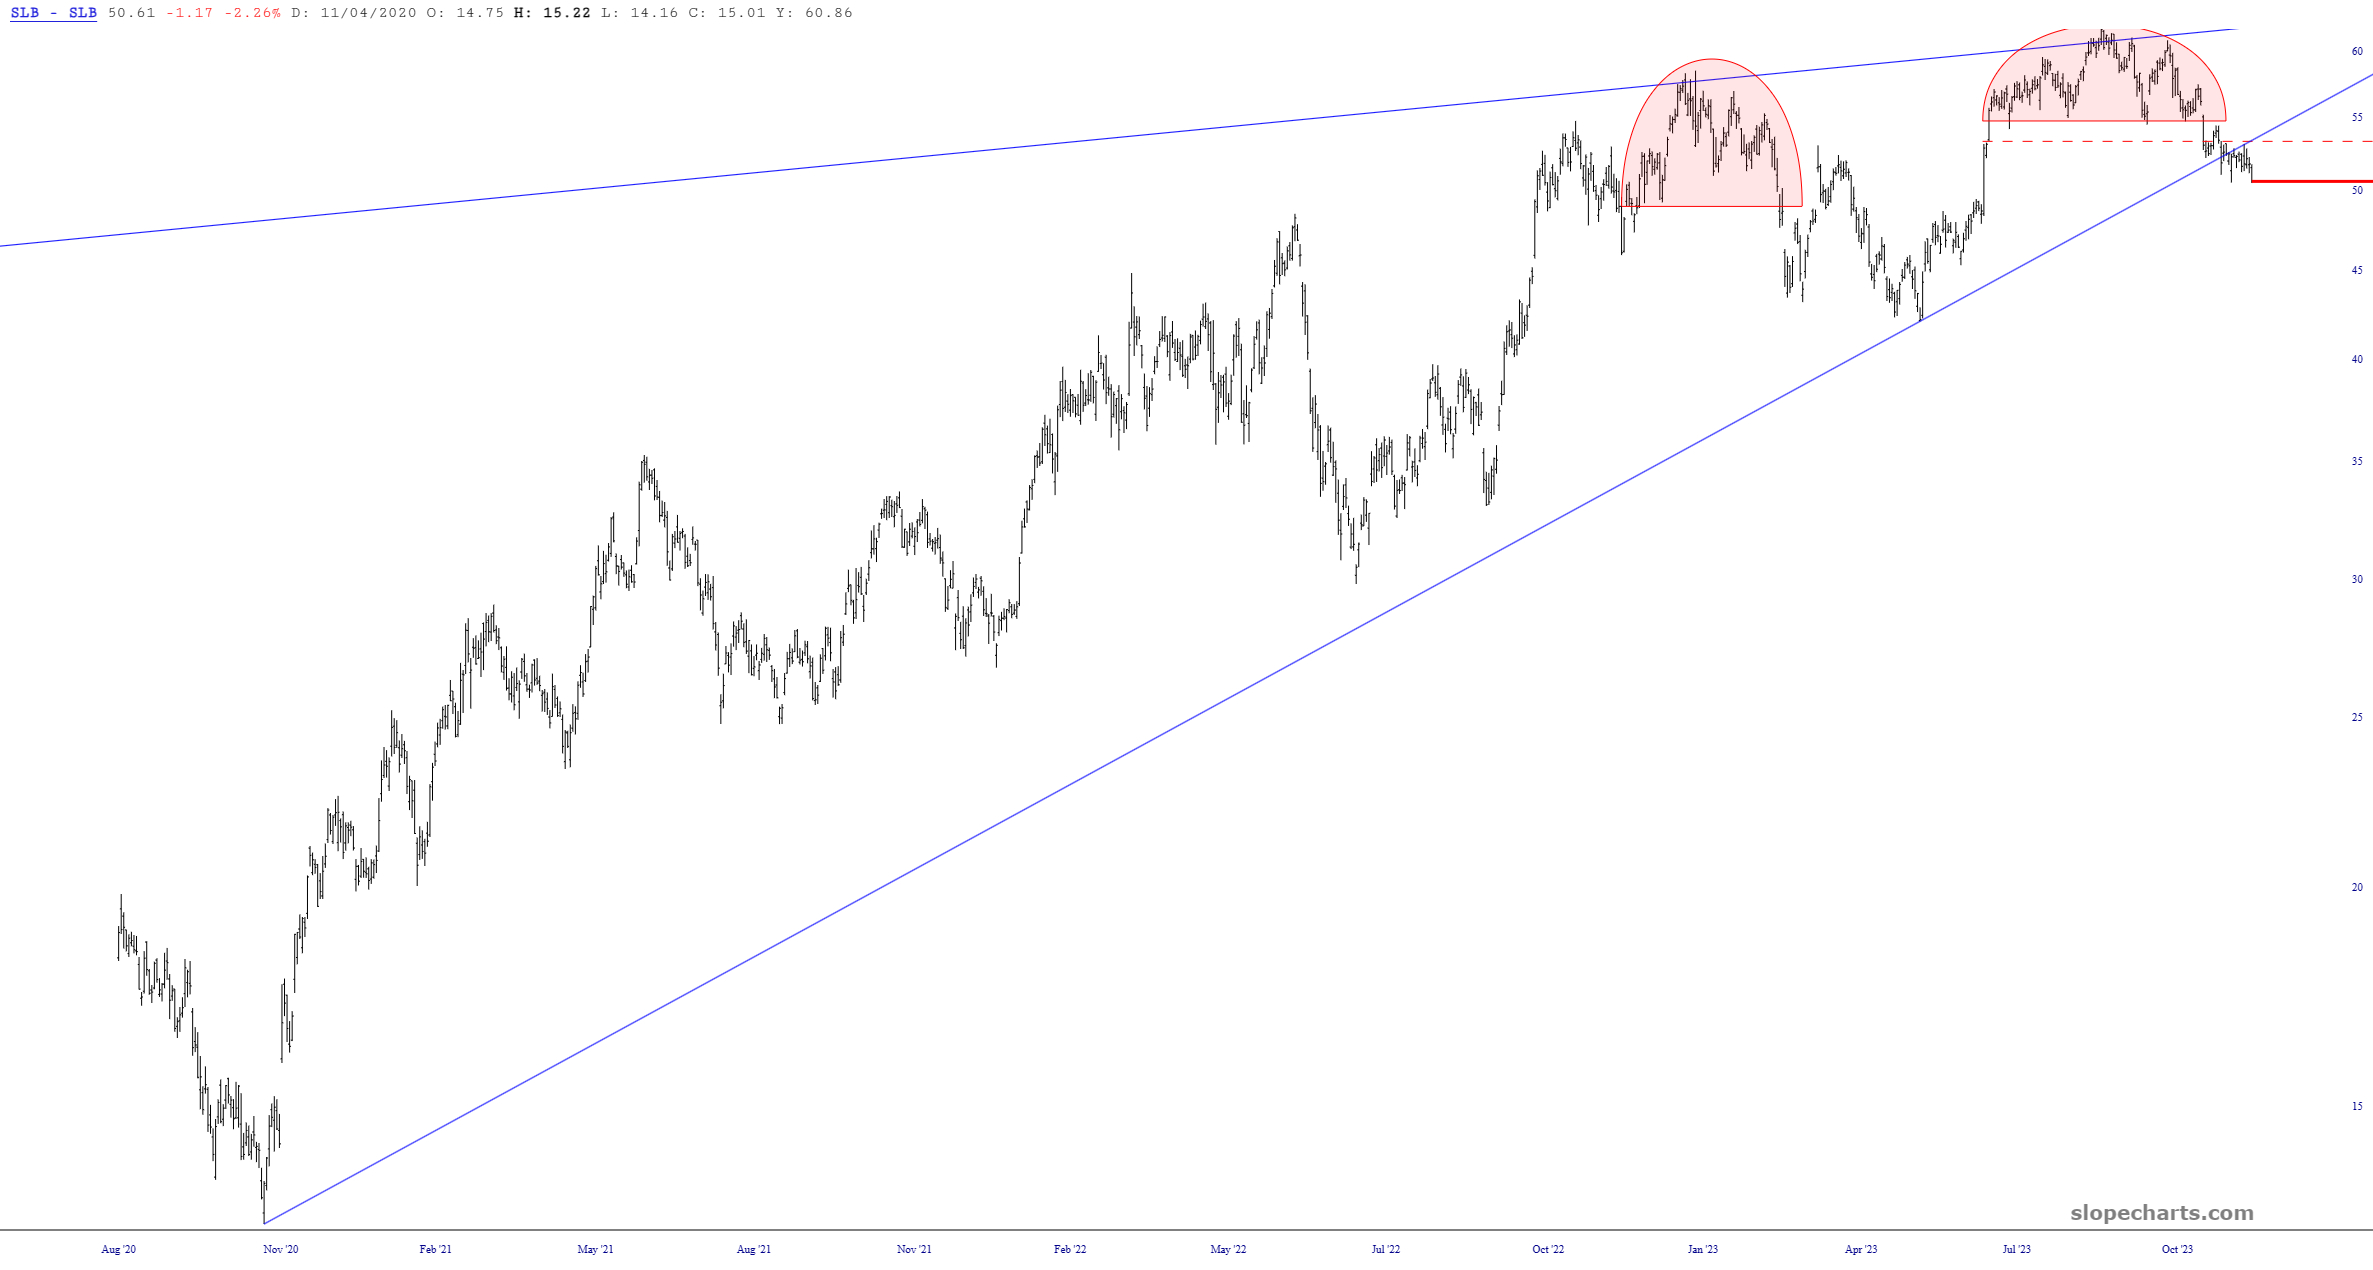
I have no position in oil, but I’ve been a steadfast fan of the two charts below, most particularly Schlumberger. SLB has already broken an enormously important uptrend, and I think COP will soon be on its heels.