
I was saying on Wednesday that I was likely to do a crypto post at least once a week in future, and here is the first, as crypto is looking very interesting today.
I’ve been covering BTCUSD, ETHUSD & SOLUSD every day in my premarket videos but haven’t actually done a post on crypto before so those are the three I cover in detail,
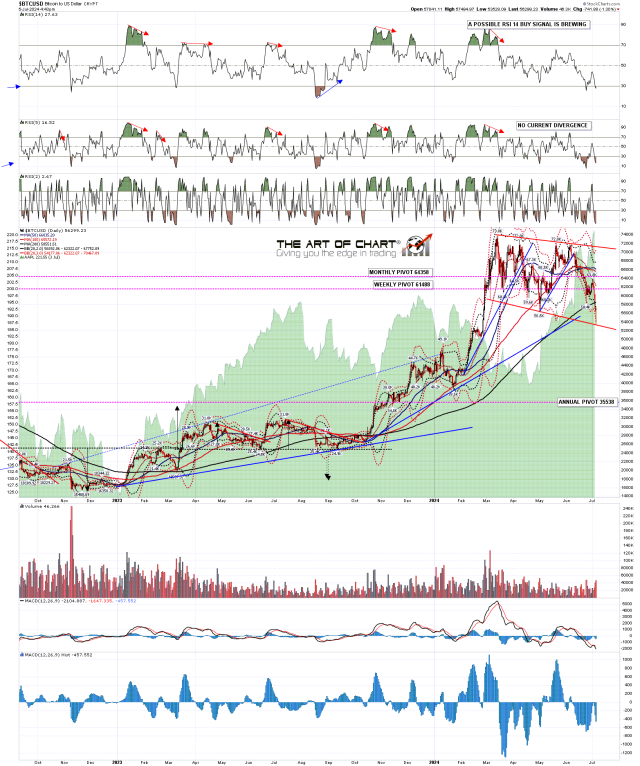
Of those three obviously Bitcoin made a big new all time high in March and since then has been consolidating, with three close to that high retests in April, May and June, and then making a new low for this consolidation this morning.
What has very likely been happening over this time is that bitcoin has been forming a high quality bull flag. I have had the bull flag megaphone shown on the chart below marked on my chart for months now, and in May that appeared to be breaking up, but never made the target and reversed back down until this morning Bitcoin hit the flag support trendline again and rejected back up there. That original flag has therefore expanded, and there is now a perfect larger bull flag formed on Bitcoin and a candidate low in place for this likely bullish consolidation.
Bitcoin rejected back up at this low, from a break of the 3sd daily lower band and a possible daily RSI 14 buy signal is brewing, and this is now a very nice looking bullish setup.
BTCUSD daily chart:
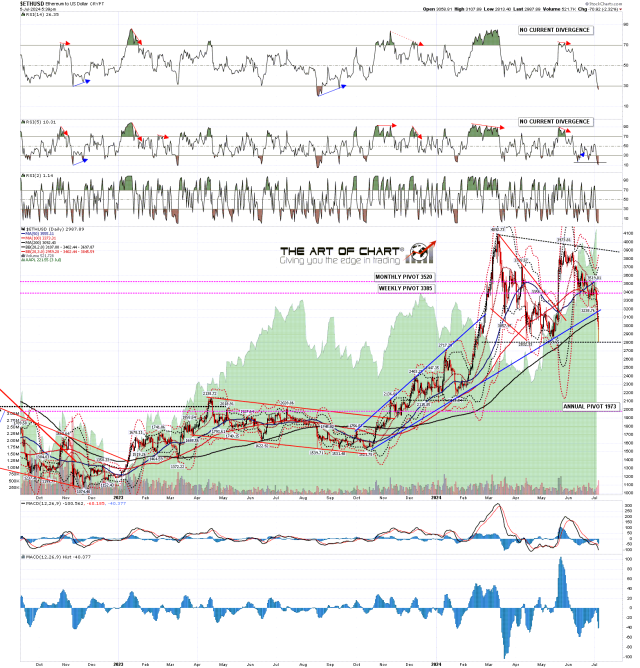
How’s that looking on ETHUSD? Not as obvious a setup but Ethereum also broke below the 3sd daily lower band, often a very nice buying opportunity and is rejecting from established support from the lows in April and May after what may have established a very decent descending triangle bull flag.
ETHUSD daily chart:
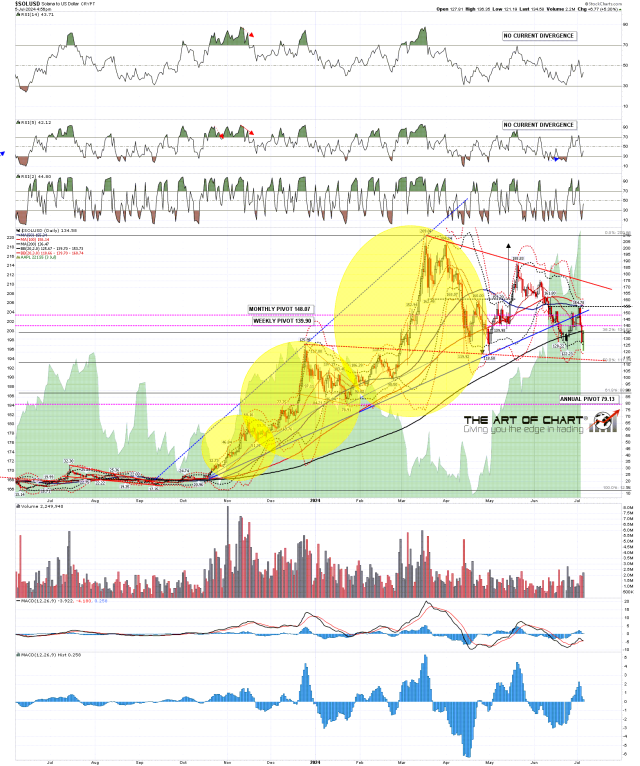
SOLUSD is a little trickier here. There is a very obvious falling wedge bull flag on Solana, but the support trendline is currently in the 114 area and was not hit this morning. However it was a very nice retest of the June low and has established a very decent quality double bottom setup. If Bitcoin & Ethereum are bottoming out here, then this is a very decent setup for Solana to do the same.
SOLUSD daily chart:
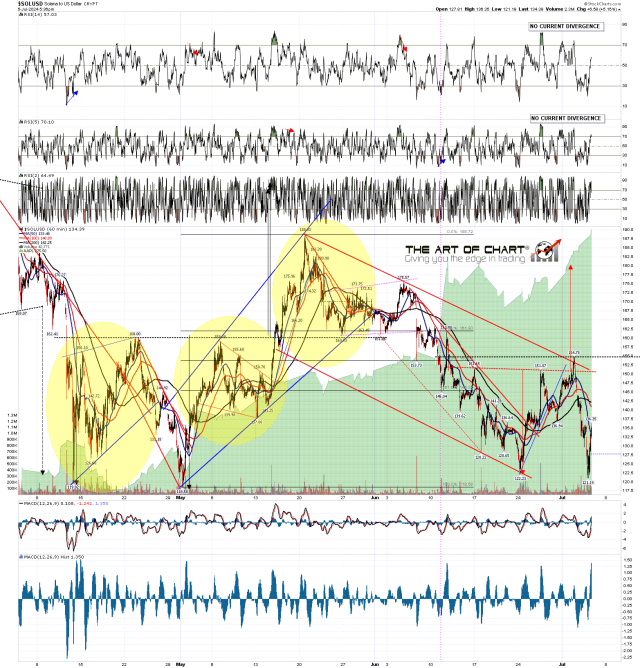
How much do these patterns mean on cryptos? A lot. I mentioned on Wednesday that cryptos are very classical chart friendly and as it happens there is a perfect example of that on the chart below.
This double bottom isn’t the first reversal pattern to form on Solana in recent days, and marked on the chart below with a red dotted IHS neckline and target arrows is the IHS that was forming last week and broke up on Friday. My rule with these reversal patterns is that when the neckline has been broken, there are two targets, and one of those is very likely to be hit. If the break up holds, then the IHS target in this instance was at 180. If price then goes below the right shoulder low, 136.94 in this instance, then the IHS has failed and the target is a full retest of the bottom of the IHS pattern, in this case at 122.23, with Solana then making a low at 121.19 this morning. That followed my rules perfectly & you see this kind of pattern target delivery on cryptos a lot.
Could cryptos all go lower? Yes. On the bull scenario Bitcoin could bullishly underthrow that flag megaphone resistance, Ethereum could go a bit lower to establish a bull flag wedge, and Solana could extend lower to hit the main bull flag wedge support trendline. On the bear scenario all of these bull flag setups could just break down, which they do about 30% of the time.
Until we see that though, this is a very solid looking short term low on all of these and we are likely looking at least for a decent rally here. This may well turn out to be the low on a big bullish consolidation with a new all time high coming next on Bitcoin, and a decent shot at new all time highs next on both Ethereum and Solana. We shall see. 🙂
SOLUSD hourly chart:
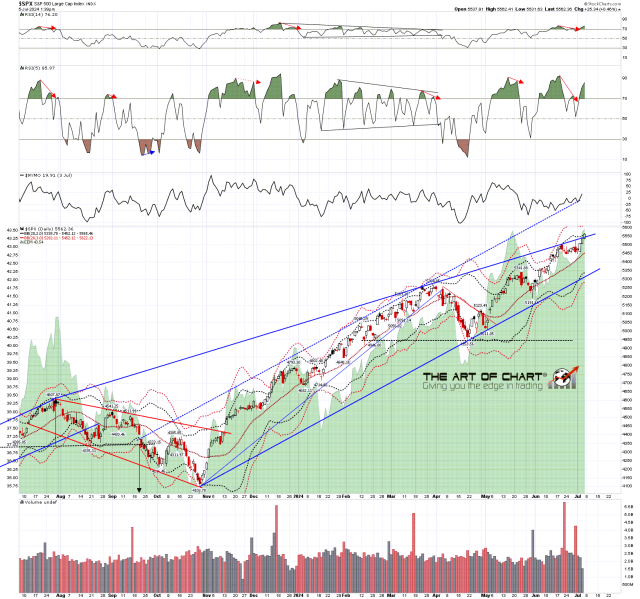
SPX is also looking interesting here & I thought I would add just one chart looking at the rising wedge on SPX.
Both SPX and NDX closed at trendline resistance today and broke over that this morning. As you can see on the SPX chart below SPX has been holding over the trendline much of the day and the breaks up on SPX and NDX may be bearish overthrows of the kind often seen at highs.
On the bull side these may also just be breaks up, and you can see on the chart below that I have a possible alternate channel resistance trendline currently in the 5750-5800 area. If this is a break up, that would be the obvious next target, though I don’t have an equivalent alternate target on NDX.
If this is a bullish overthrow though, this is the high, or very close to it, we have daily sell signals fixed or brewing on both SPX and NDX, and the overthrows would be telling us that on the next leg down the rising support trendlines on SPX and NDX should break, with that currently in the 5315 area on SPX and 17000 area on NDX. This could therefore be a significant high that could hold for a few months. We shall see next week & I’m leaning towards the bear scenario but very much keeping an open mind.
SPX daily BBs chart:
In my last post I mentioned my friend launching a product to help people navigate the crypto world and the first introduction webinar for that was on Wednesday. If that is something that might interest you and you missed the webinar you can see a recording of that here.
Everyone have a great weekend 🙂
