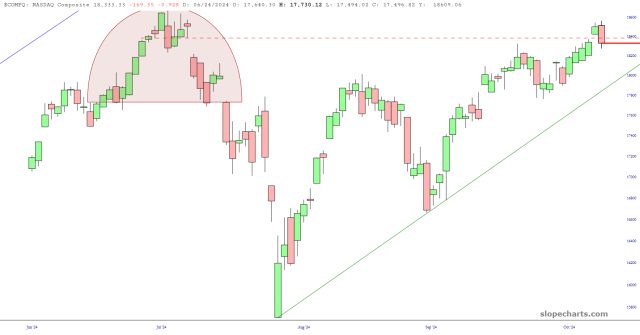
It was a very interesting Tuesday. Let’s look at five index charts. The first, the NASDAQ Composite, blew past its price gap Monday, only to fall back below the gap Tuesday. Not only is it a failed bullish breakout, it is also a bearish engulfing pattern.
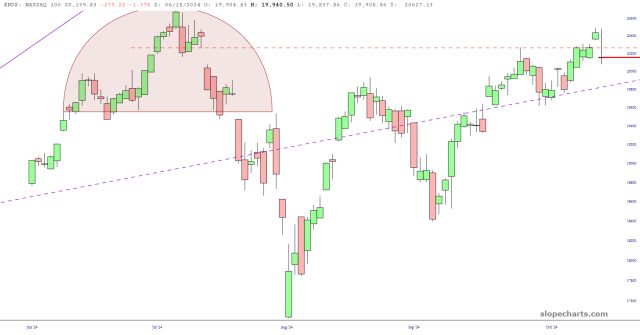
The exact same thing can be said for NASDAQ 100. What will it take to really get tech stocks falling to pieces? A bunch of bad earnings reports would do the trick.
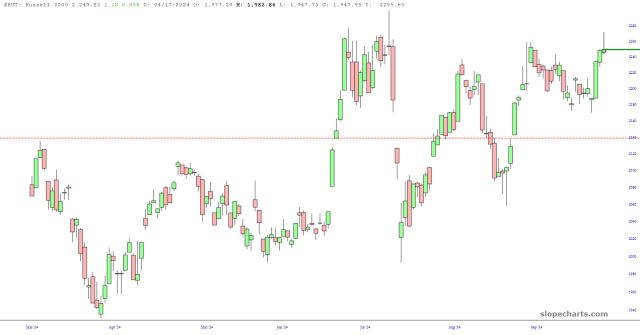
The Russell 2000 was insanely strong on Friday, but Tuesday produced a shooting star candlestick. A weak Wednesday would make this more meaningful.
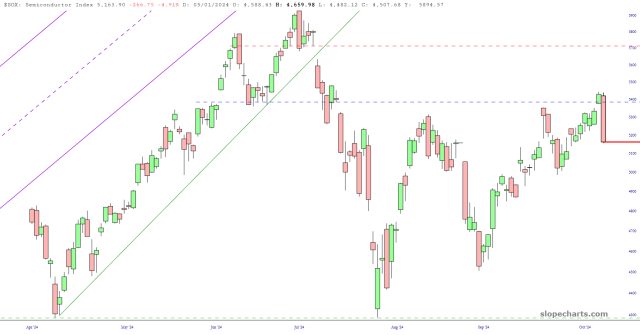
Thanks to the ASML face-plant, with their cockamamie story about accidentally releasing earnings, the whole semiconductor space had an intraday reversal on a grand scale.
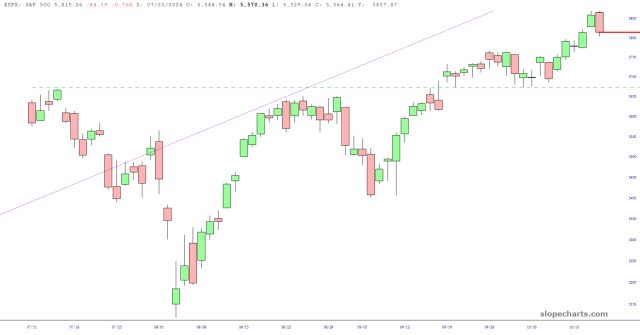
Lastly the S&P 500 hammered out a beautiful bearish engulfing pattern as well. Let’s see if, for the first time in 27 years, we actually get two down days in a row.