It’s ready! It’s ready! I hope you enjoy our latest creation.
The Global Economic Charts page is a feature for Gold and Platinum subscribers that provide exclusive access to dozens of crucial economic charts for hundreds of countries. Virtually every country on the planet is covered, giving you access to thousands of charts spanning decades of historical data.
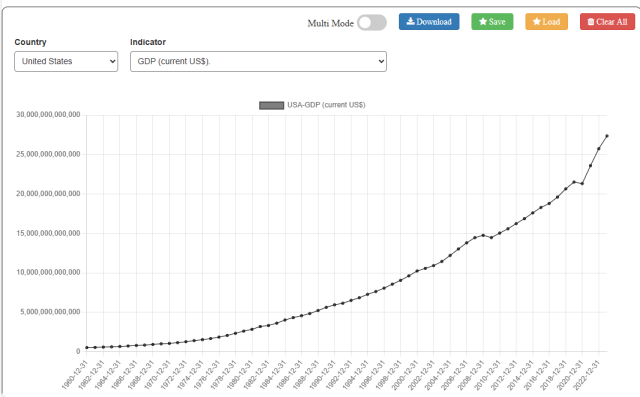
The initial presentation of this page provides access to any single chart for one country. The default choice is the GDP for the United States.
There are a variety of controls on the page:
- Multi-Mode toggle gives you the ability to places multiple sets of data on a single chart;
- Download will save the chart you are look at to your device;
- Save will save the chart you have created for easy access later;
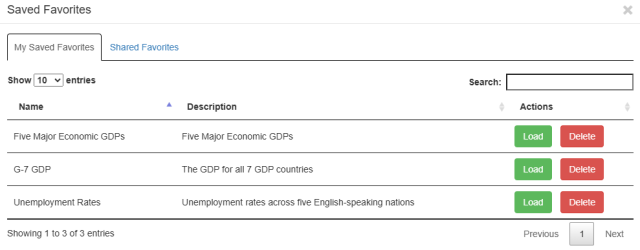
- Load brings up the dialog box of all your saved charts as well as any charts other members of the Slope community, including yourself, have decided to share;
- Clear All resets the page so you can start fresh
The two dropdowns let you choose the Country (left side) and Indicator (right side) you want to see. Once you have selected a dropdown, you can optionally use the up and down arrows on your keyboard to navigate the data.
Below, for example, the United States has been selected as a country, and pressing the down arrow on the keyboard allows the user to thumb through all the data sets available.
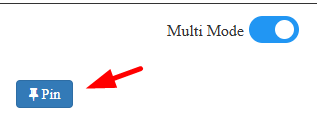
When the Multi Mode toggle is flipped on, a Pin button appears. The purpose of this button is to let you affirm that a given chart you are examining to be saved to the Multi-Chart you are creating. You can thumb through as many charts are you desire in order to find what you want, and clicking Pin commits that specific chart to the consolidated chart.
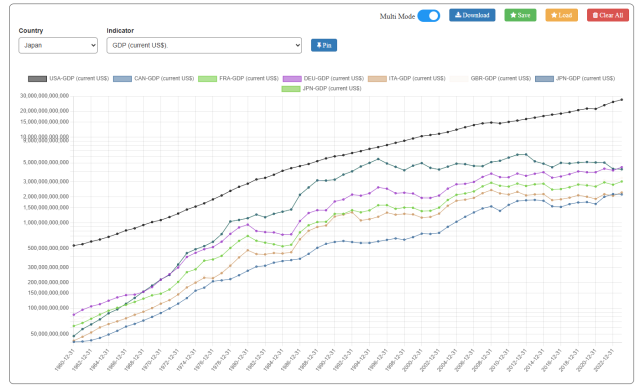
Below, for example, is a Multi-Chart of the seven countries comprising the G-7. Since it takes some time to assemble something this complex, you should use the Save button to preserve your hard work for later, instant access.
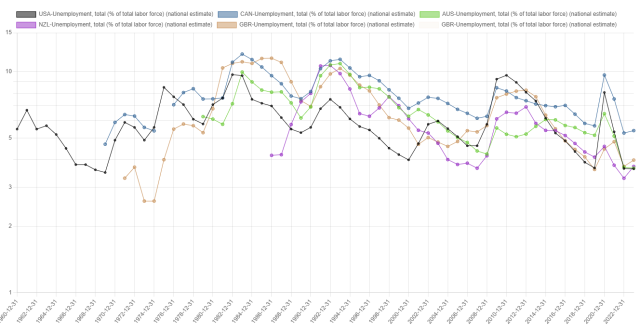
Here is another example which, in this instance, is the unemployment rate among various countries. Of course, you can mix and match any data types that you want. The Multi-Chart does not have to be comprised of elements from the same country or the same indicator.
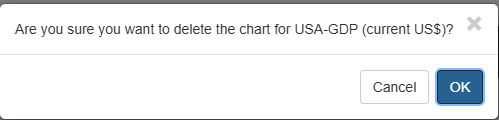
If you want to remove one of the charts from a Multi-Chart, point to the item in the legend (at the top of the chart) corresponding to the item you want to remove. Click on it, and this dialog box will appear to confirm you do in fact want to delete that specific item:
Saving charts is both a time saver and, if you choose, a nice way to share your creations with the Slope community as a whole. When you click Load, the dialog box below appears with two tabs. The first tab, My Saved Favorites, shows you any items you have saved for yourself, and you can either Load or Delete any of them. The second time, Shared Favorites, shows the charts available for the entire Slope community, any of which you are free to load.