
In my last post on Thursday 8th May I was looking at the bear flag inflection point that US equity markets were in last week. That broke up hard on the 90 day delay on most of the China tariffs over the weekend.
I was saying in that post that a break and conversion of the 200dma on SPX would open a possible retest of the all time highs, and the 200dma on SPX has now been converted with a strong gap over it on Monday and closes well above it every day this week.
Is this the end of market excitement this year? I think probably not, but it is the end of the beginning of that market excitement, and I think a retest of the SPX all time high soon is now likely.
After that I still think that the main event of the markets this year may be based around a crisis in the bond markets but elsewhere there are still important points to remember.
In terms of China, only the tariffs imposed on the 8th & 9th of April were paused, that leaves the 20% imposed by Trump in his first term, and the 10% baseline and 20% fentanyl tariffs imposed by Trump this year. That is still an impressive 50%, not an embargo level but still a level that will limit trade and raise a lot of prices.
In terms of the effect of tariffs the Yale Budget Lab published an interesting analysis that is well worth a read, but key takeaways are that consumers still face an overall effective tariff rate of 17.8%, the highest since 1934, and the increase will likely cost the average US household $2,800 in 2025.
This is the highest effective tax increase on US households since the 1960s I understand and, while the administration is still in denial about that, it will soon enough be unambiguously obvious to every US consumer who isn’t too rich to notice.
The US budget deficit is higher than ever and current tax and spend plans, if they manage to get through both houses, will make that situation significantly worse. This is an important part of why I have been writing since November about a possible major bonds crisis in the second half of 2025.
This is therefore likely just a pause for breath, the US is still likely in recession in my view, and there may still be a significant effect on inflation, which is the reason the Fed has not been cutting interest rates while most other developed world central banks have been cutting theirs.
What this pause for breath should deliver however is an opportunity to see some of these economic and fiscal numbers come through. By the time this ninety day pause expires we will have another couple of months of inflation and deficit numbers numbers and should also have the growth numbers for Q2 2025. That should clarify where the US economy stands here.
So what’s next for US equity markets? Well the first thing that strikes me on the daily chart, apart from the break and conversion of the 200dma of course, is that the RSI 5 is now over 90. This is a very high level, only hit five times in the last two years. What happened on those other five occasions?
Firstly I would note that on all five occasions there was a modest retracement or consolidation within a couple of days of reaching the daily RSI 5 90 level. That was always modest, the largest retracement was 80 points and most were significantly less than that though all delivered a decline in the RSI 5 level, with three of those taking that RSI 5 level under 70.
Secondly I would note that on all five occasions there was then a higher high on price with a lower high on RSI 5, setting an RSI 5 sell signal brewing and then all five fixed that sell signal with a larger decline than the first one. Three of those sell signals then made the sell signal target at 30-5 on the RSI 5, and two failed as price went considerably higher, which is a much worse hit rate than sell signals established at lower levels on the RSI 5, but is indicative of a strong trend, which we may well have here, for now at least.
Only one of these RSI 5 spikes over 90 preceded a significant high delivering a decline of more than 5%.
From here this means that SPX likely at least consolidates without going much higher for two weeks and then we could see a larger retracement but without any strong expectation of a big decline. I am wondering though about a possible backtest of the 200dma, currently in the 5760 area.
SPX daily BBs chart:

What are the shorter term charts telling us here? Well the bear flags from last week are all broken and they have been replaced by …… nothing obvious as yet. The stats already say that we are unlikely to be looking at a significant high here but I also mention regularly that if there are no clear patterns it is usually because the current move is not close to finished. The hourly charts are telling us that price is likely heading significantly higher, and that means that retests of the all time highs on SPX and QQQ are likely, and that a retest of the all time high on DIA is possible.
In the shorter term there is a high quality possible hourly RSI 14 sell signal on SPX and I’m expecting this to fix and play out in a modest retracement in the next three or four trading days.
SPX 60min chart:

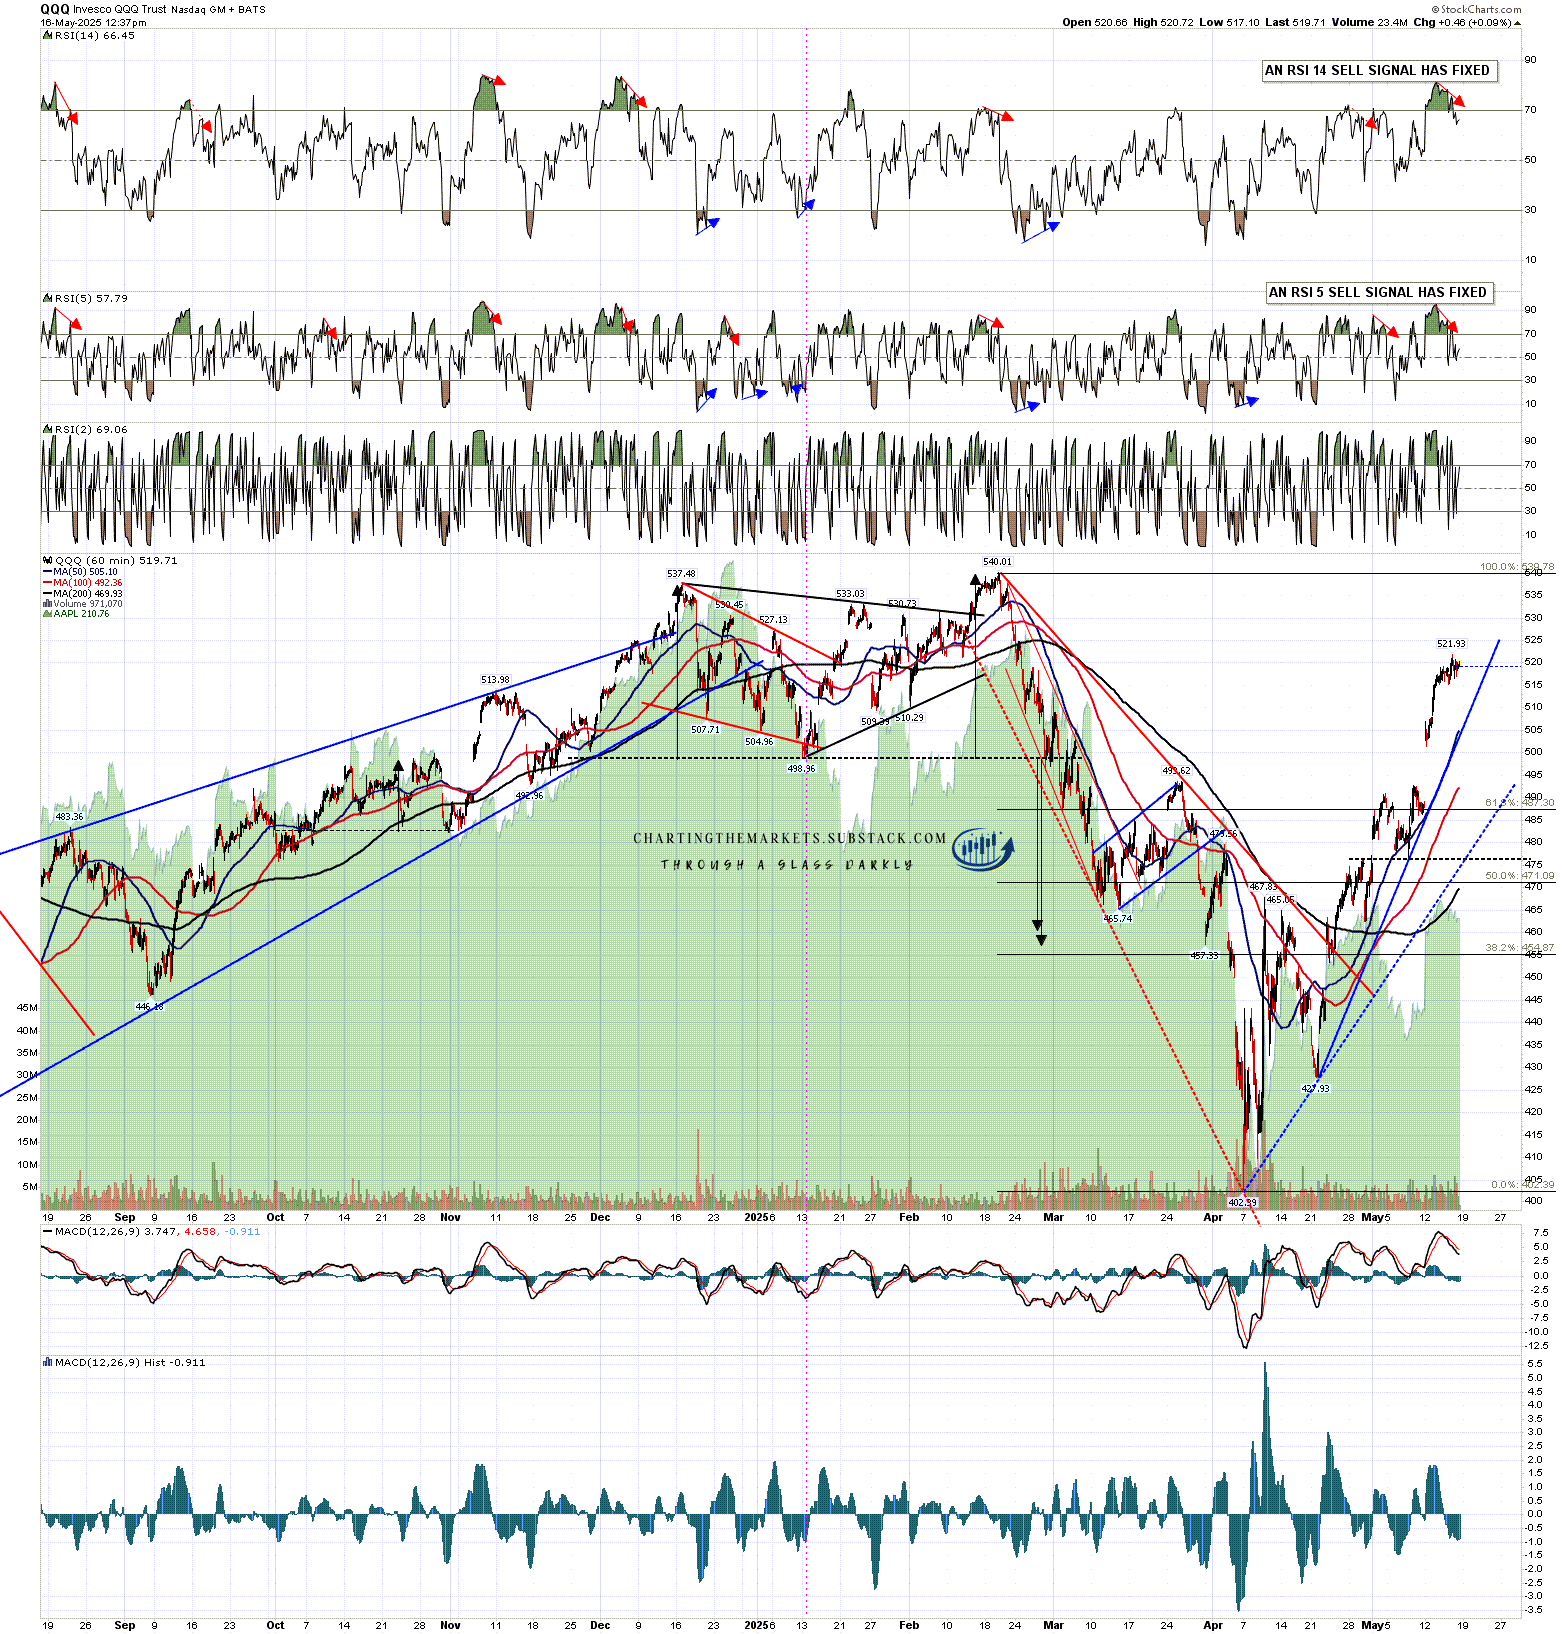
On QQQ a high quality hourly RSI 14 sell signal has already fixed.
QQQ 60min chart:
There’s not much prospect of an hourly RSI 14 sell signal on DIA, but I would note that DIA is now starting to test a significant support/resistance price zone 426.5 to 429.5. This would be a very good area to see retracement/consolidation for a few days.
DIA 60min chart:

I’ve been following the TSLA chart with a lot of interest this year and I sent this chart to my free subscribers this morning as the first one in a new series of ‘Chart of the Day’ that I’m starting to send out, as I’ve always found these interesting from other analysts in the past.
In my post on 12th March I showed the H&S on TSLA that had broken down with a target in the 148 area. On 17th April I then showed an updated chart with a possible double bottom on it that on a sustained break up would look for the 370 area.
That double bottom did break up hard and so far TSLA has managed to reached the 50% retracement of the decline from the all time high. This is where those two patterns come into conflict. If TSLA reaches that double bottom target in the 370 area it will need to rise past the H&S right shoulder high at 367.34. That would invalidate the H&S and the H&S target, and potentially open a retest of the all time high, though in this particular case I’m very doubtful about seeing that retest this year, or possibly ever. We’ll see.
TSLA daily chart:

I’ve been saying the following on all my posts so far this year:
As I have been since the start of 2025 I’m still leaning on the bigger picture towards a weak first half of 2025 and new all time highs later in the year, very possibly as a topping process for a much more significant high. One way or another I think we’ll be seeing lower soon and I’m not expecting this to be a good year for US equities, not least because both of the last two years have been banner years for US equities. A third straight year of these kinds of gains looks like a big stretch. I could of course however be mistaken. UPDATE 11th March 2025 – I am wondering if this may be a bear market that dominates the whole of 2025.
This is going faster than I expected and it looks like we may see both the initial weakness and the new all time highs in the first half of this year. I remain doubtful about seeing much more than retests of the all time highs and I think we may well see a lot of further market disruption in the second half of 2025. We’ll see how that goes. Everyone have a great weekend. 🙂
If you like my analysis and would like to see more, please take a free subscription at my chartingthemarkets substack, where I publish these posts first. I also do a premarket video every day on equity indices, bonds, currencies, energies, precious commodities and other commodities at 8.45am EST. If you’d like to see those I post the links every morning on my twitter, and the videos are posted shortly afterwards on my Youtube channel.
