
I have left crypto alone for a while, but I’d like to at least anticipate when I would be interested in putting on a trade. I’ll start with Ethereum, which I believe could rally until it hits that dashed blue line (at $2600 or thereabouts).

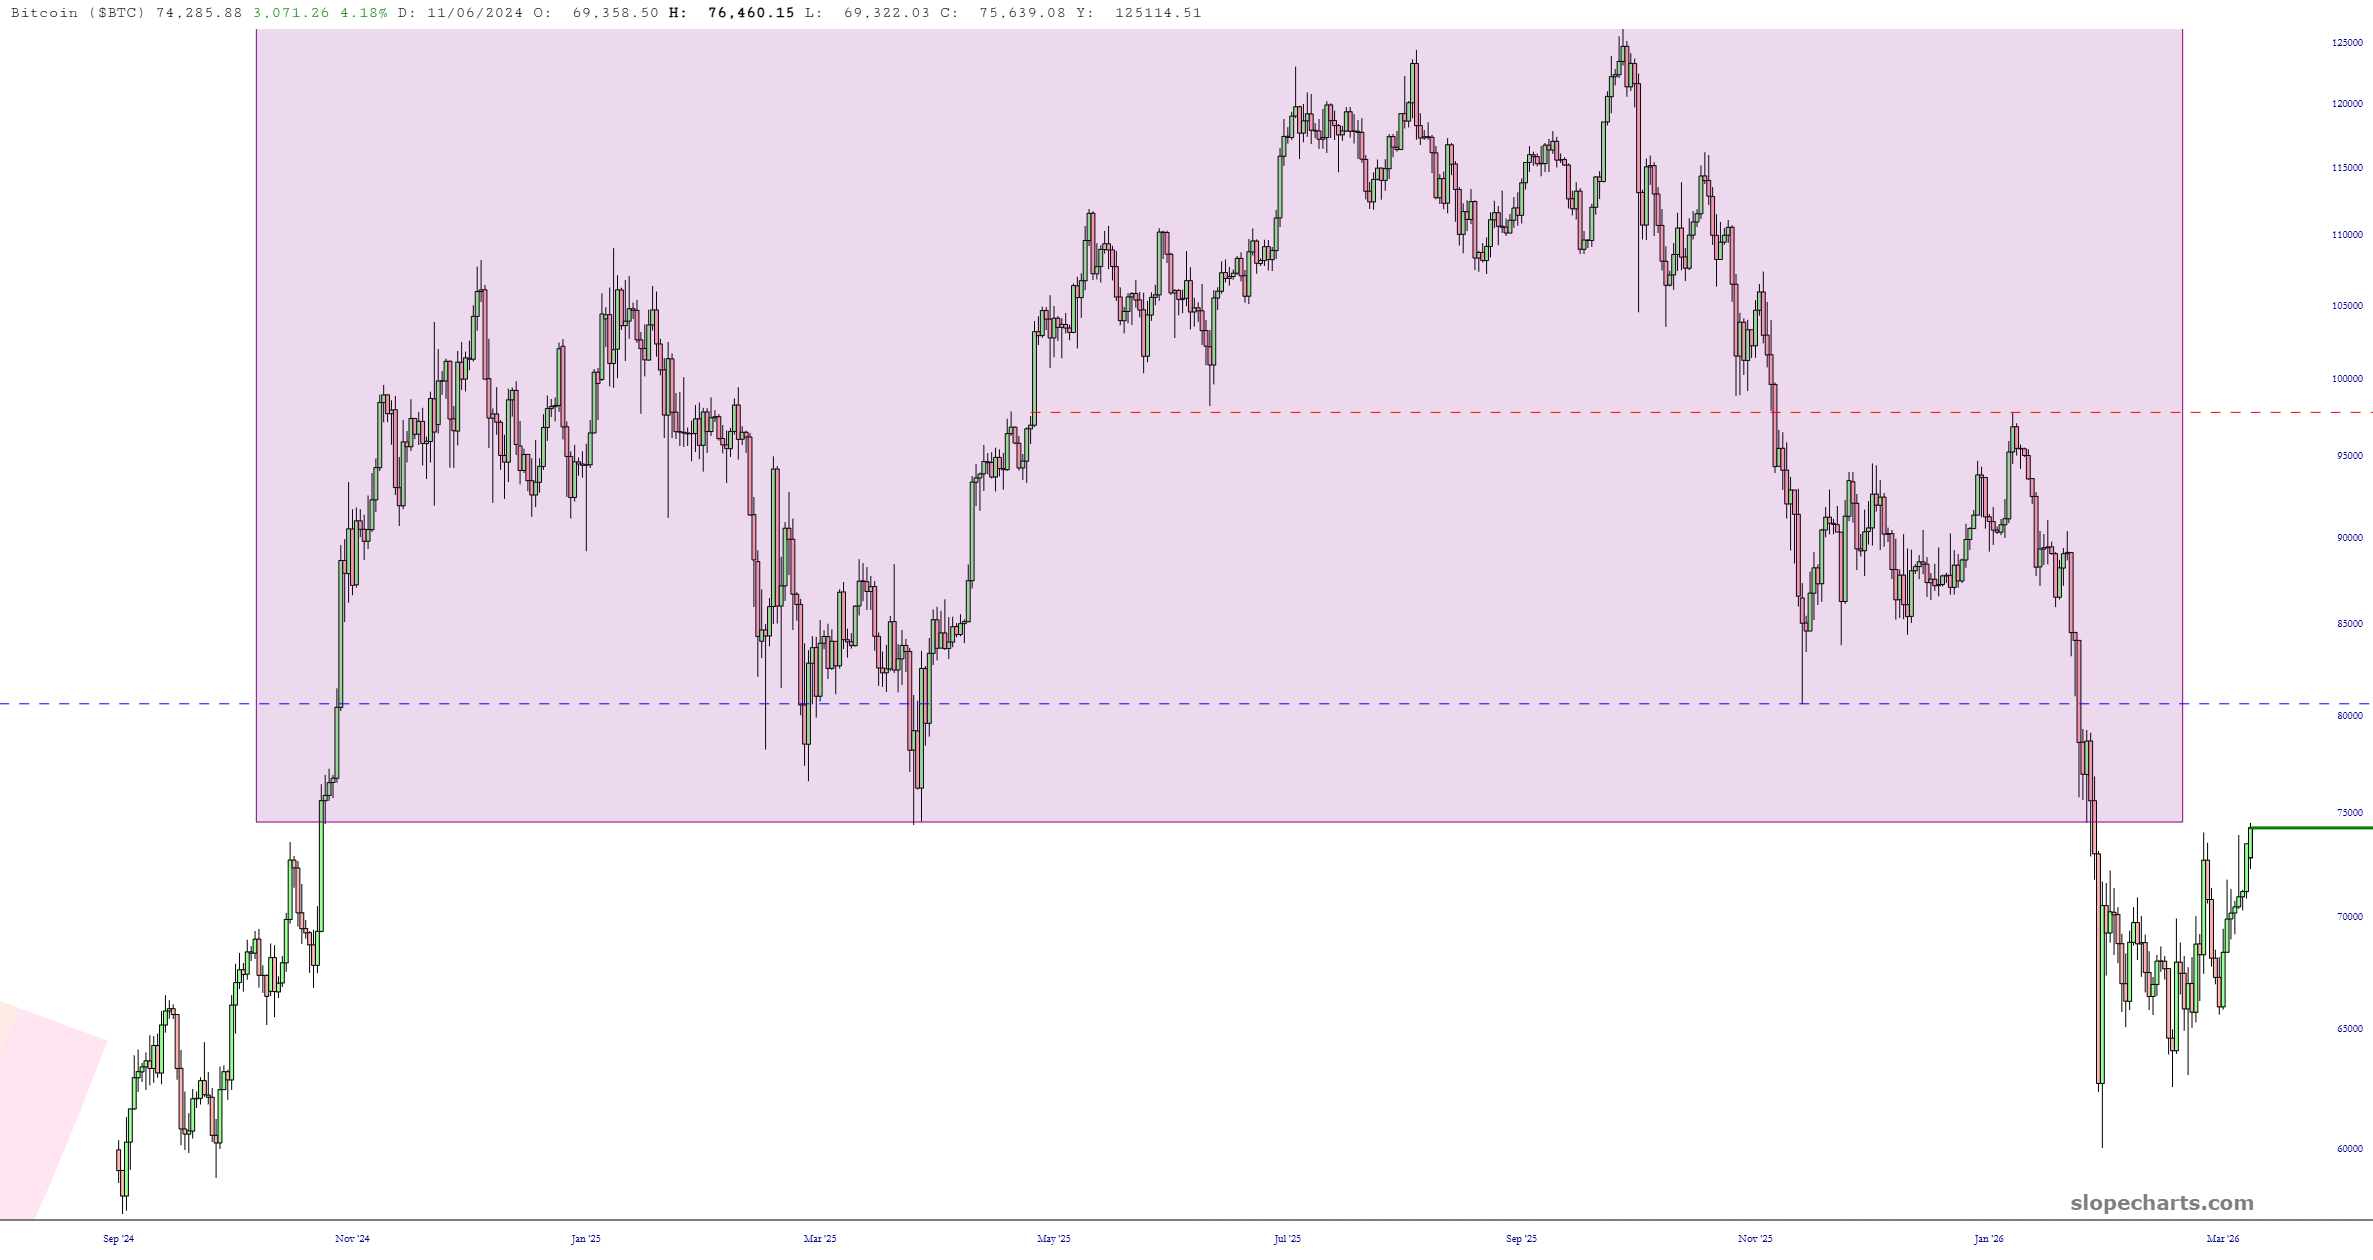
Bitcoin, likewise, has room to rise some more. Its own dashed line is just beneath $81,000, which is nearly 10% higher from present price levels.
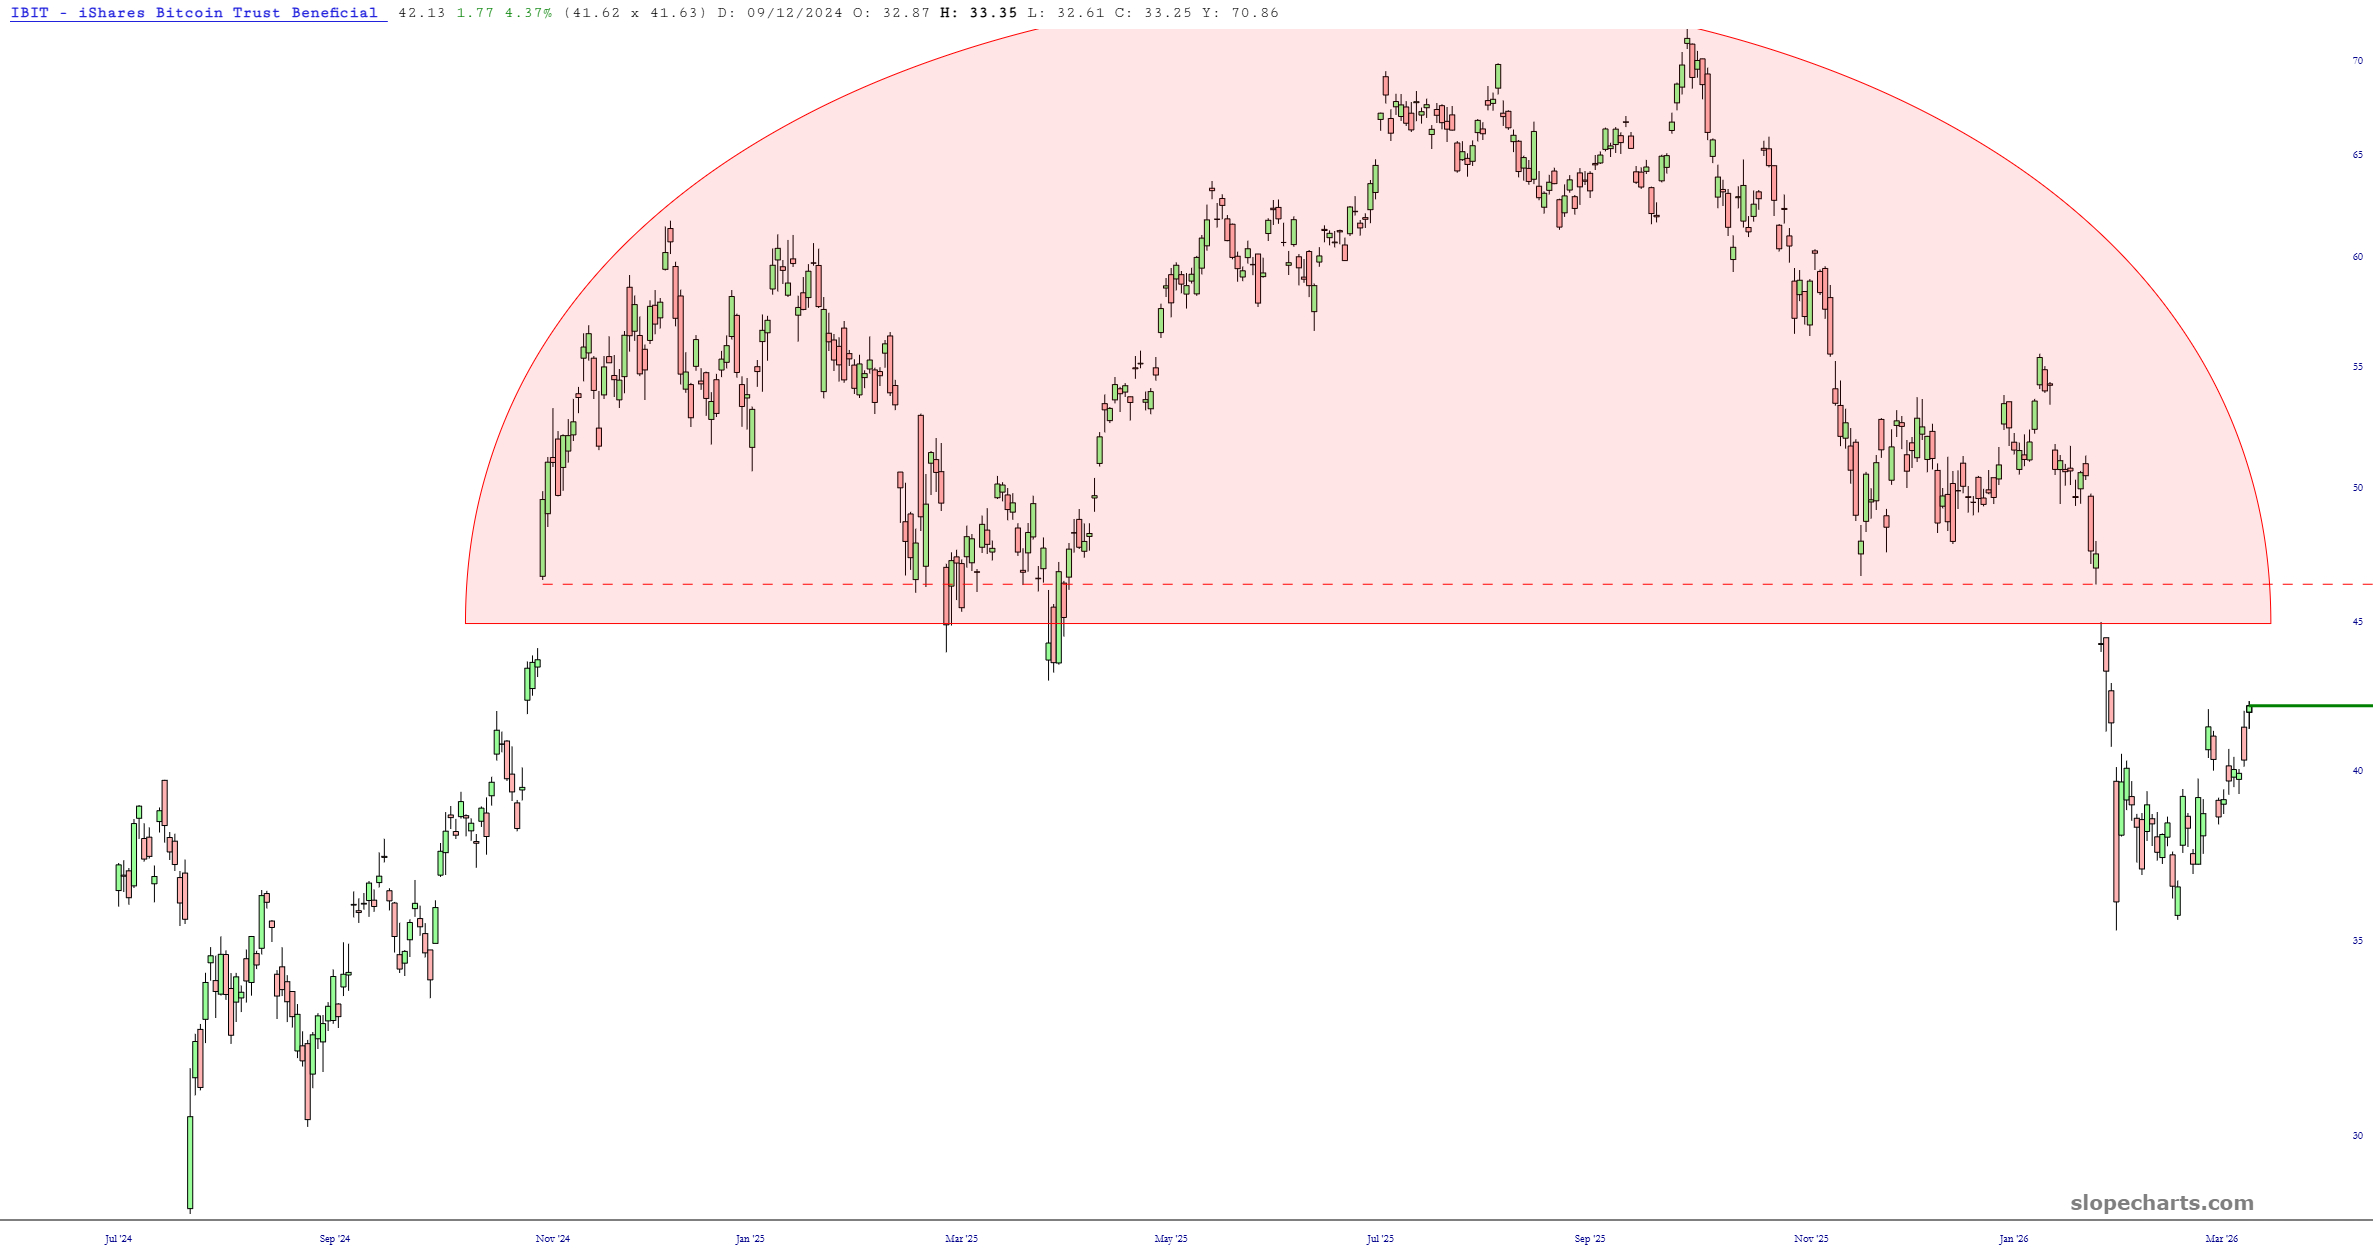
Another way to look at this is by way of IBIT, whose own price gap correlates nicely to the end-of-January price failure.
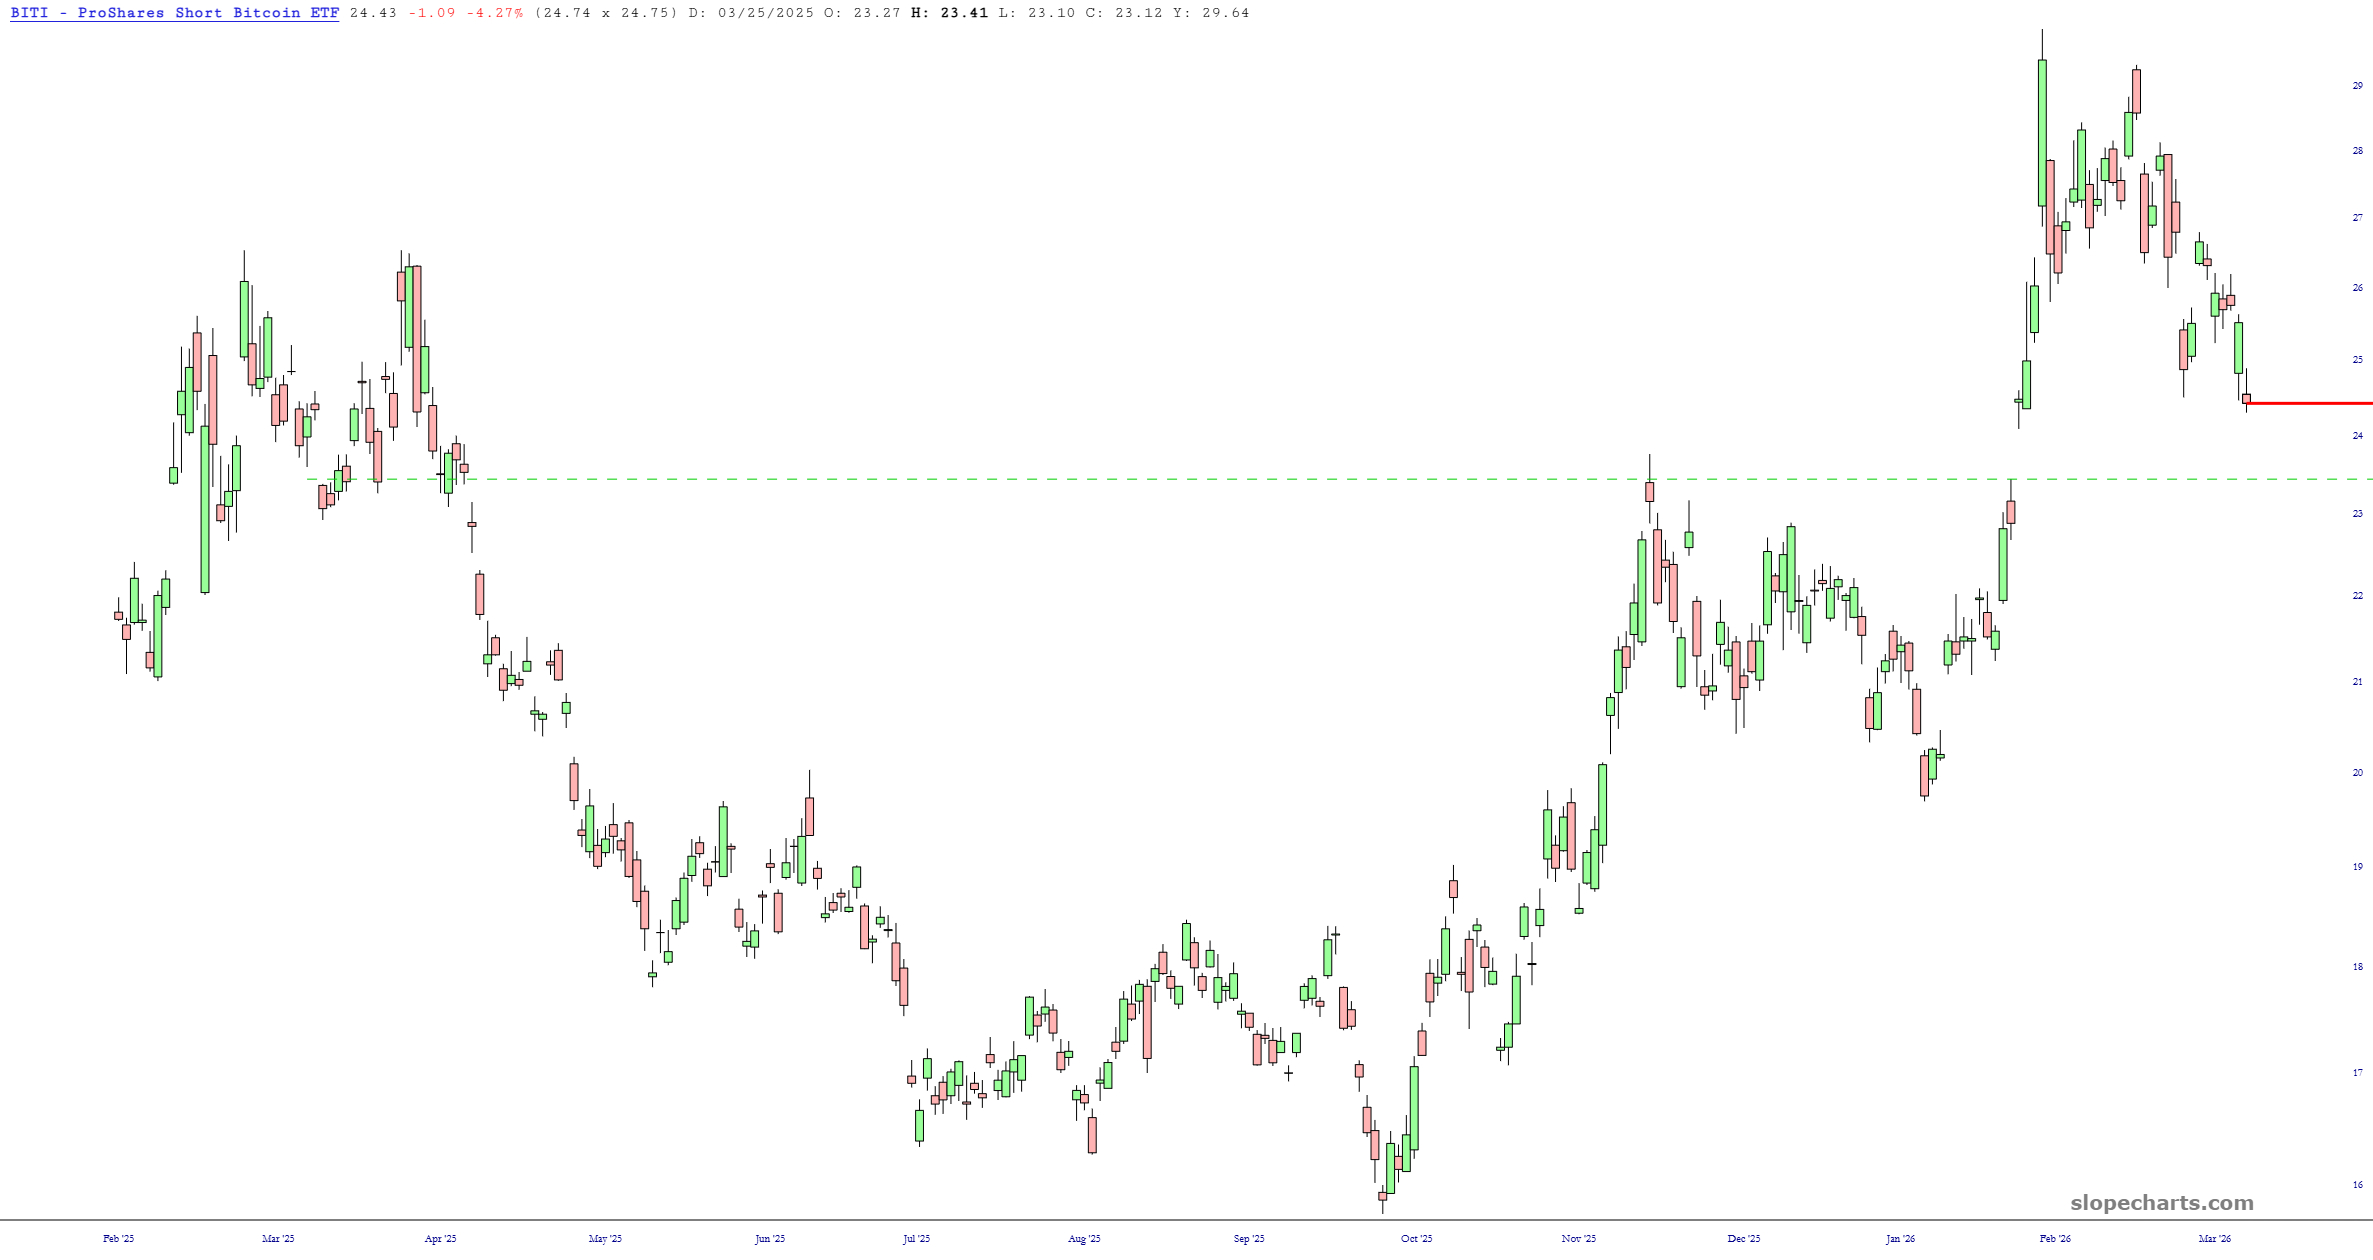
Alternately, look at BITI, the inverse bitcoin fund (which is how I’d go about placing the trade). The same price gap is beckoning there.
As an equity bear, it’s a little unsettling to believe that Bitcoin could have about 10% upside before exhausting itself, because crypto does tend to correlate rather strongly to stocks.
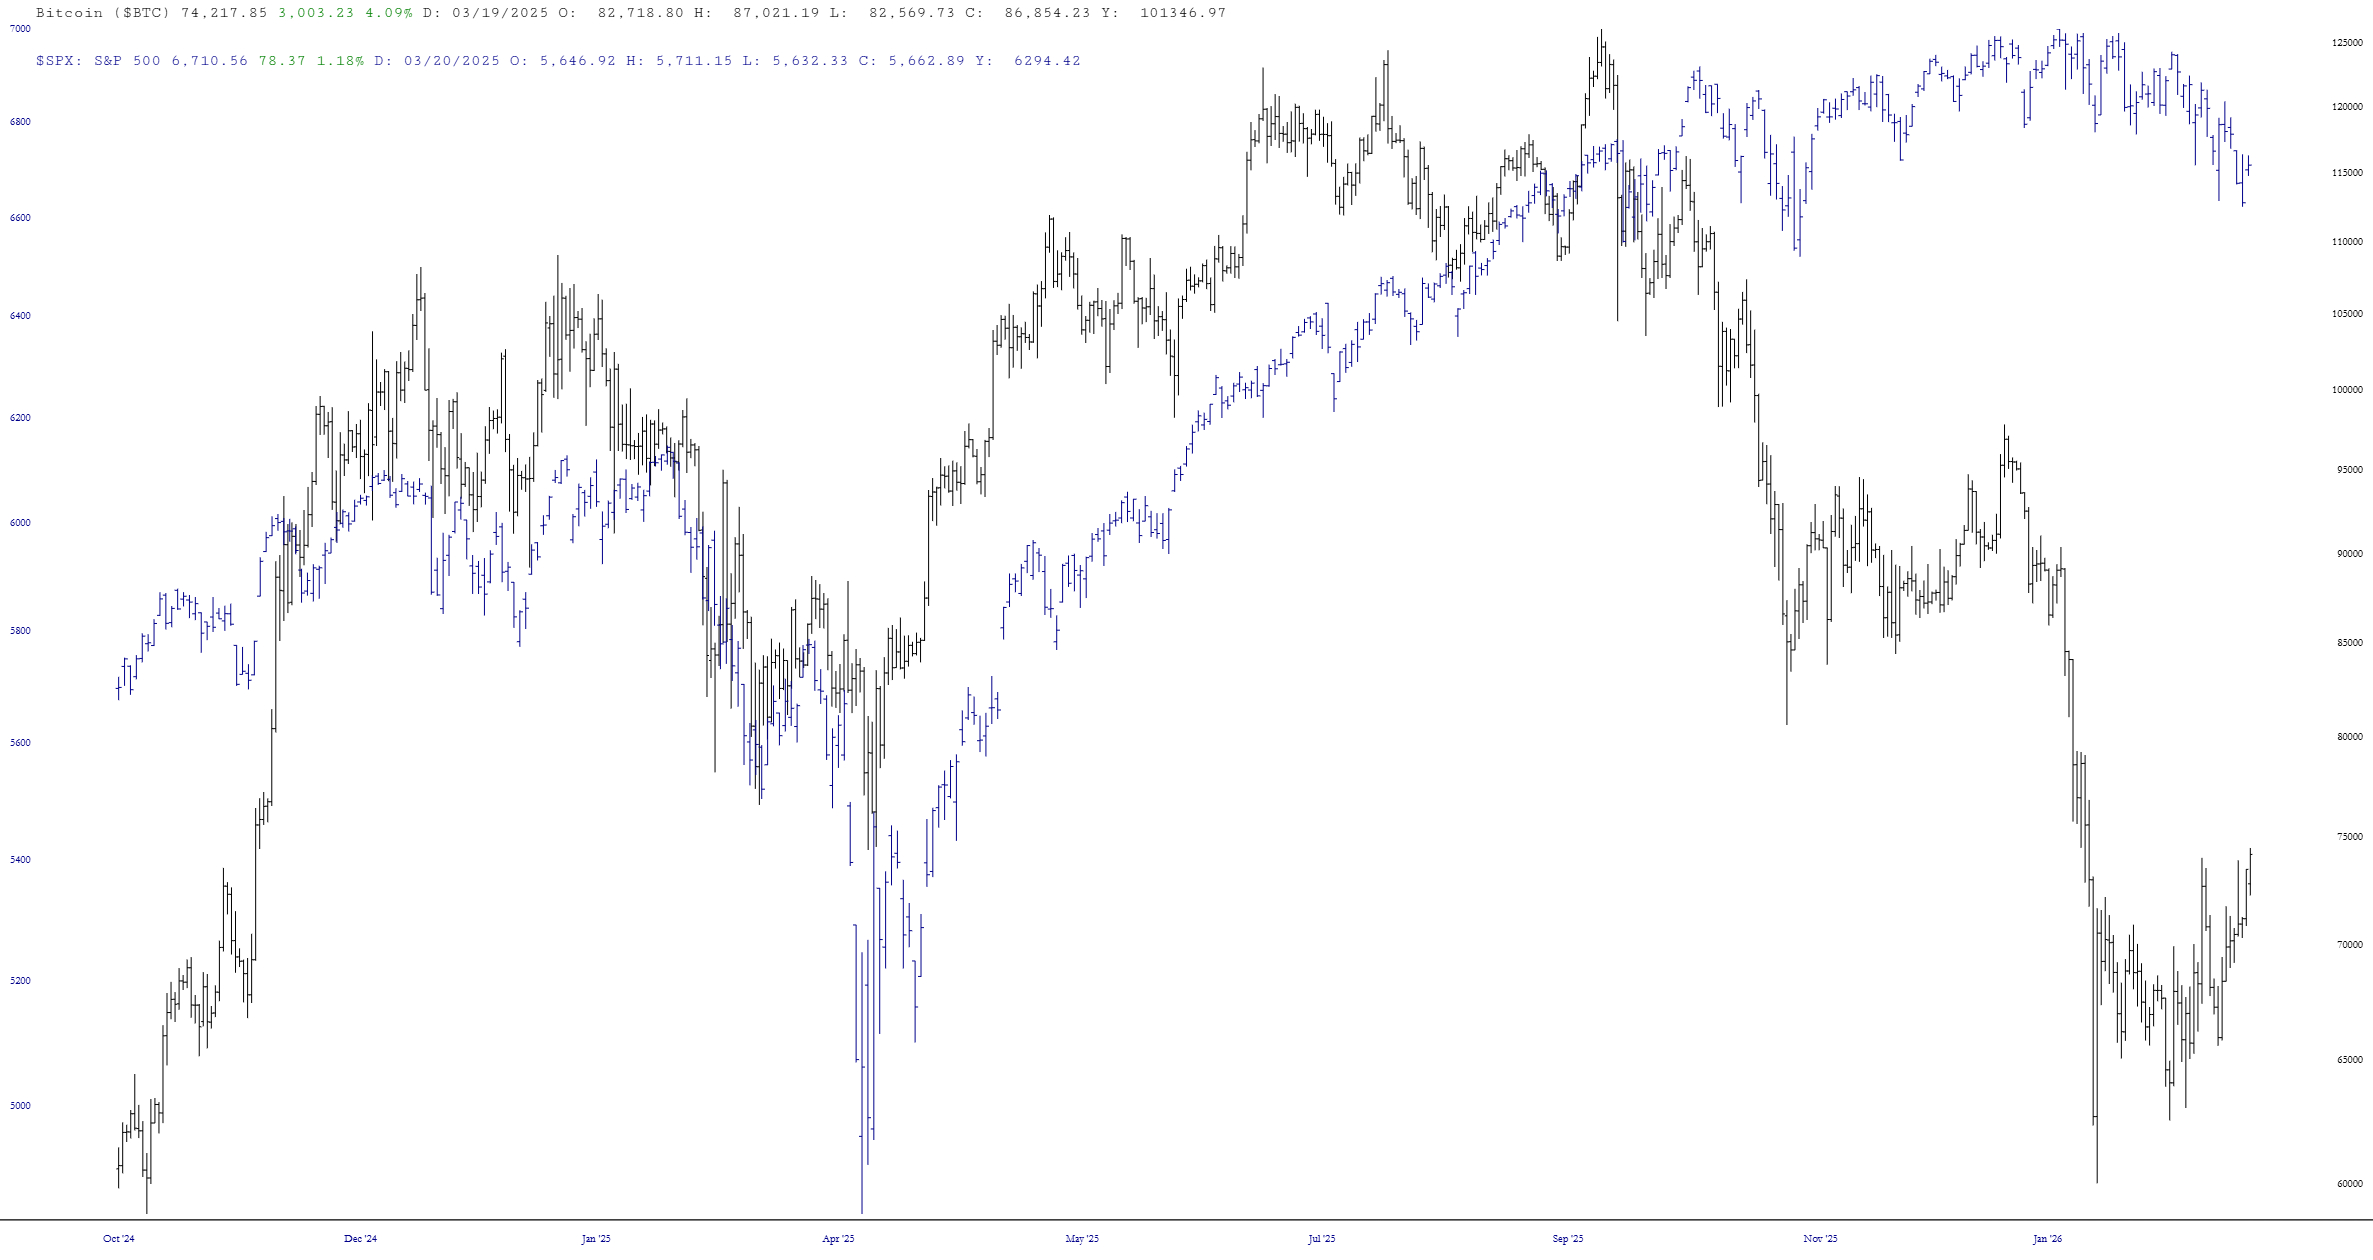
Below is a layered chart illustrating, over a fully six years, how Bitcoin (black line) tends to trade strongly with the S&P 500 (blue line). There are times that the gap between them is substantial, such as recently, whereas for the bulk of this chart they were virtually in lockstep.
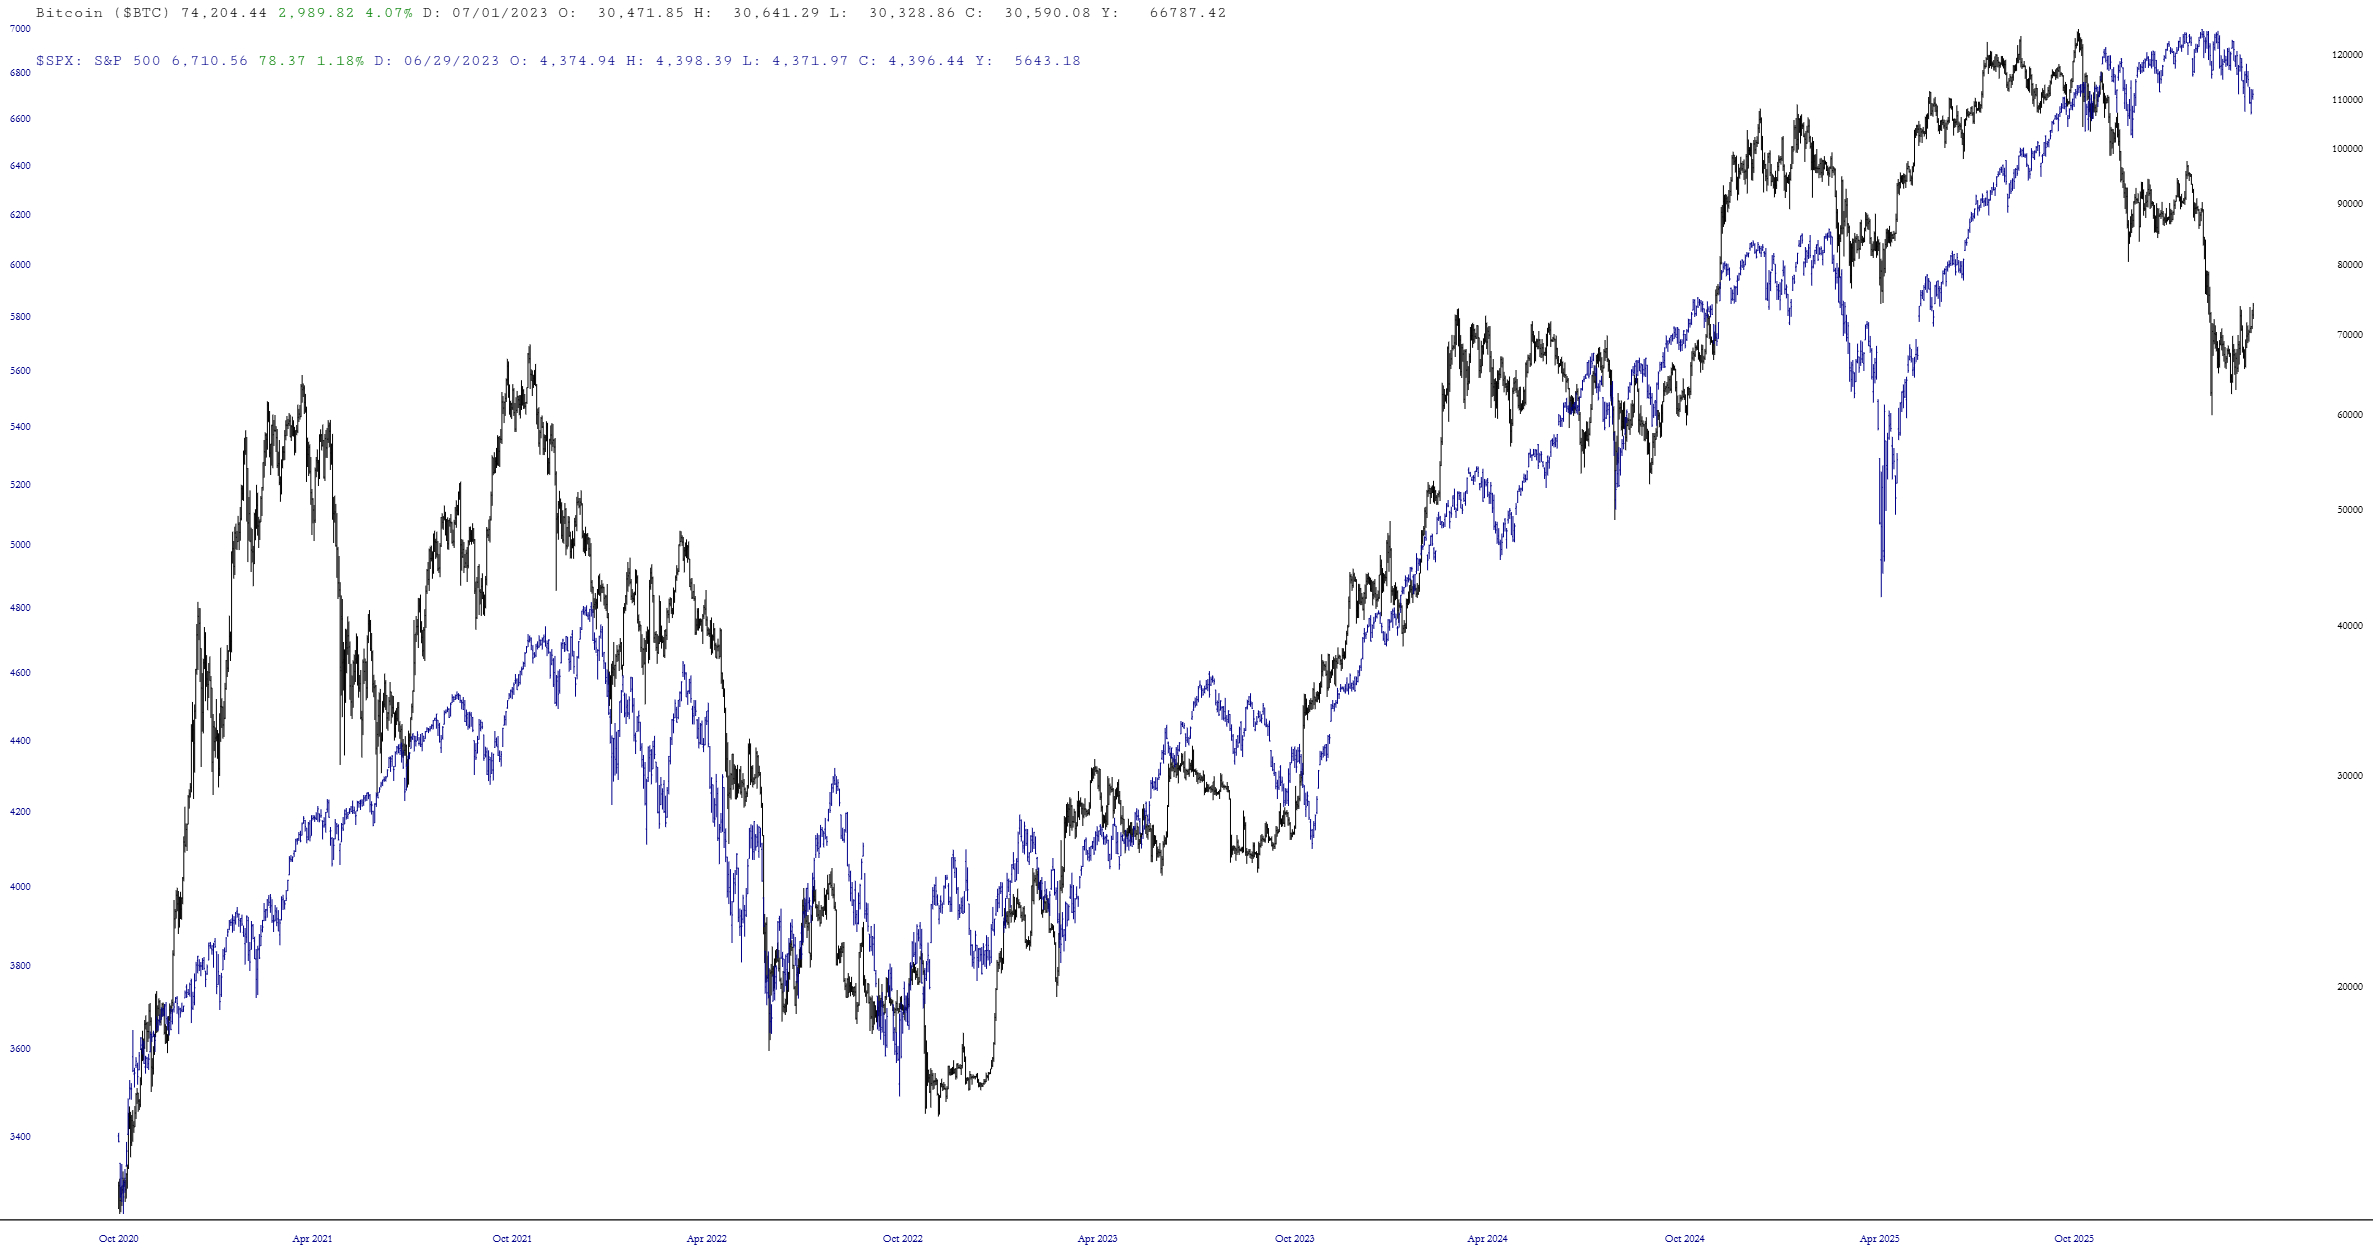
Looking much more recently, you can see how stocks have been surprisingly hearty in the face of a wipeout in with Bitcoin. I’m not sure is Bitcoin is going to rise, or stocks are going to fall (or both) in order to reconcile this gap, or even if reconciliation is even required. Still, given the historically strong correlation, this tremendous gap is hard to ignore.
What this means for stocks is inscrutable to me, but I do know that as far as crypto goes, I’m going to bide my time.
