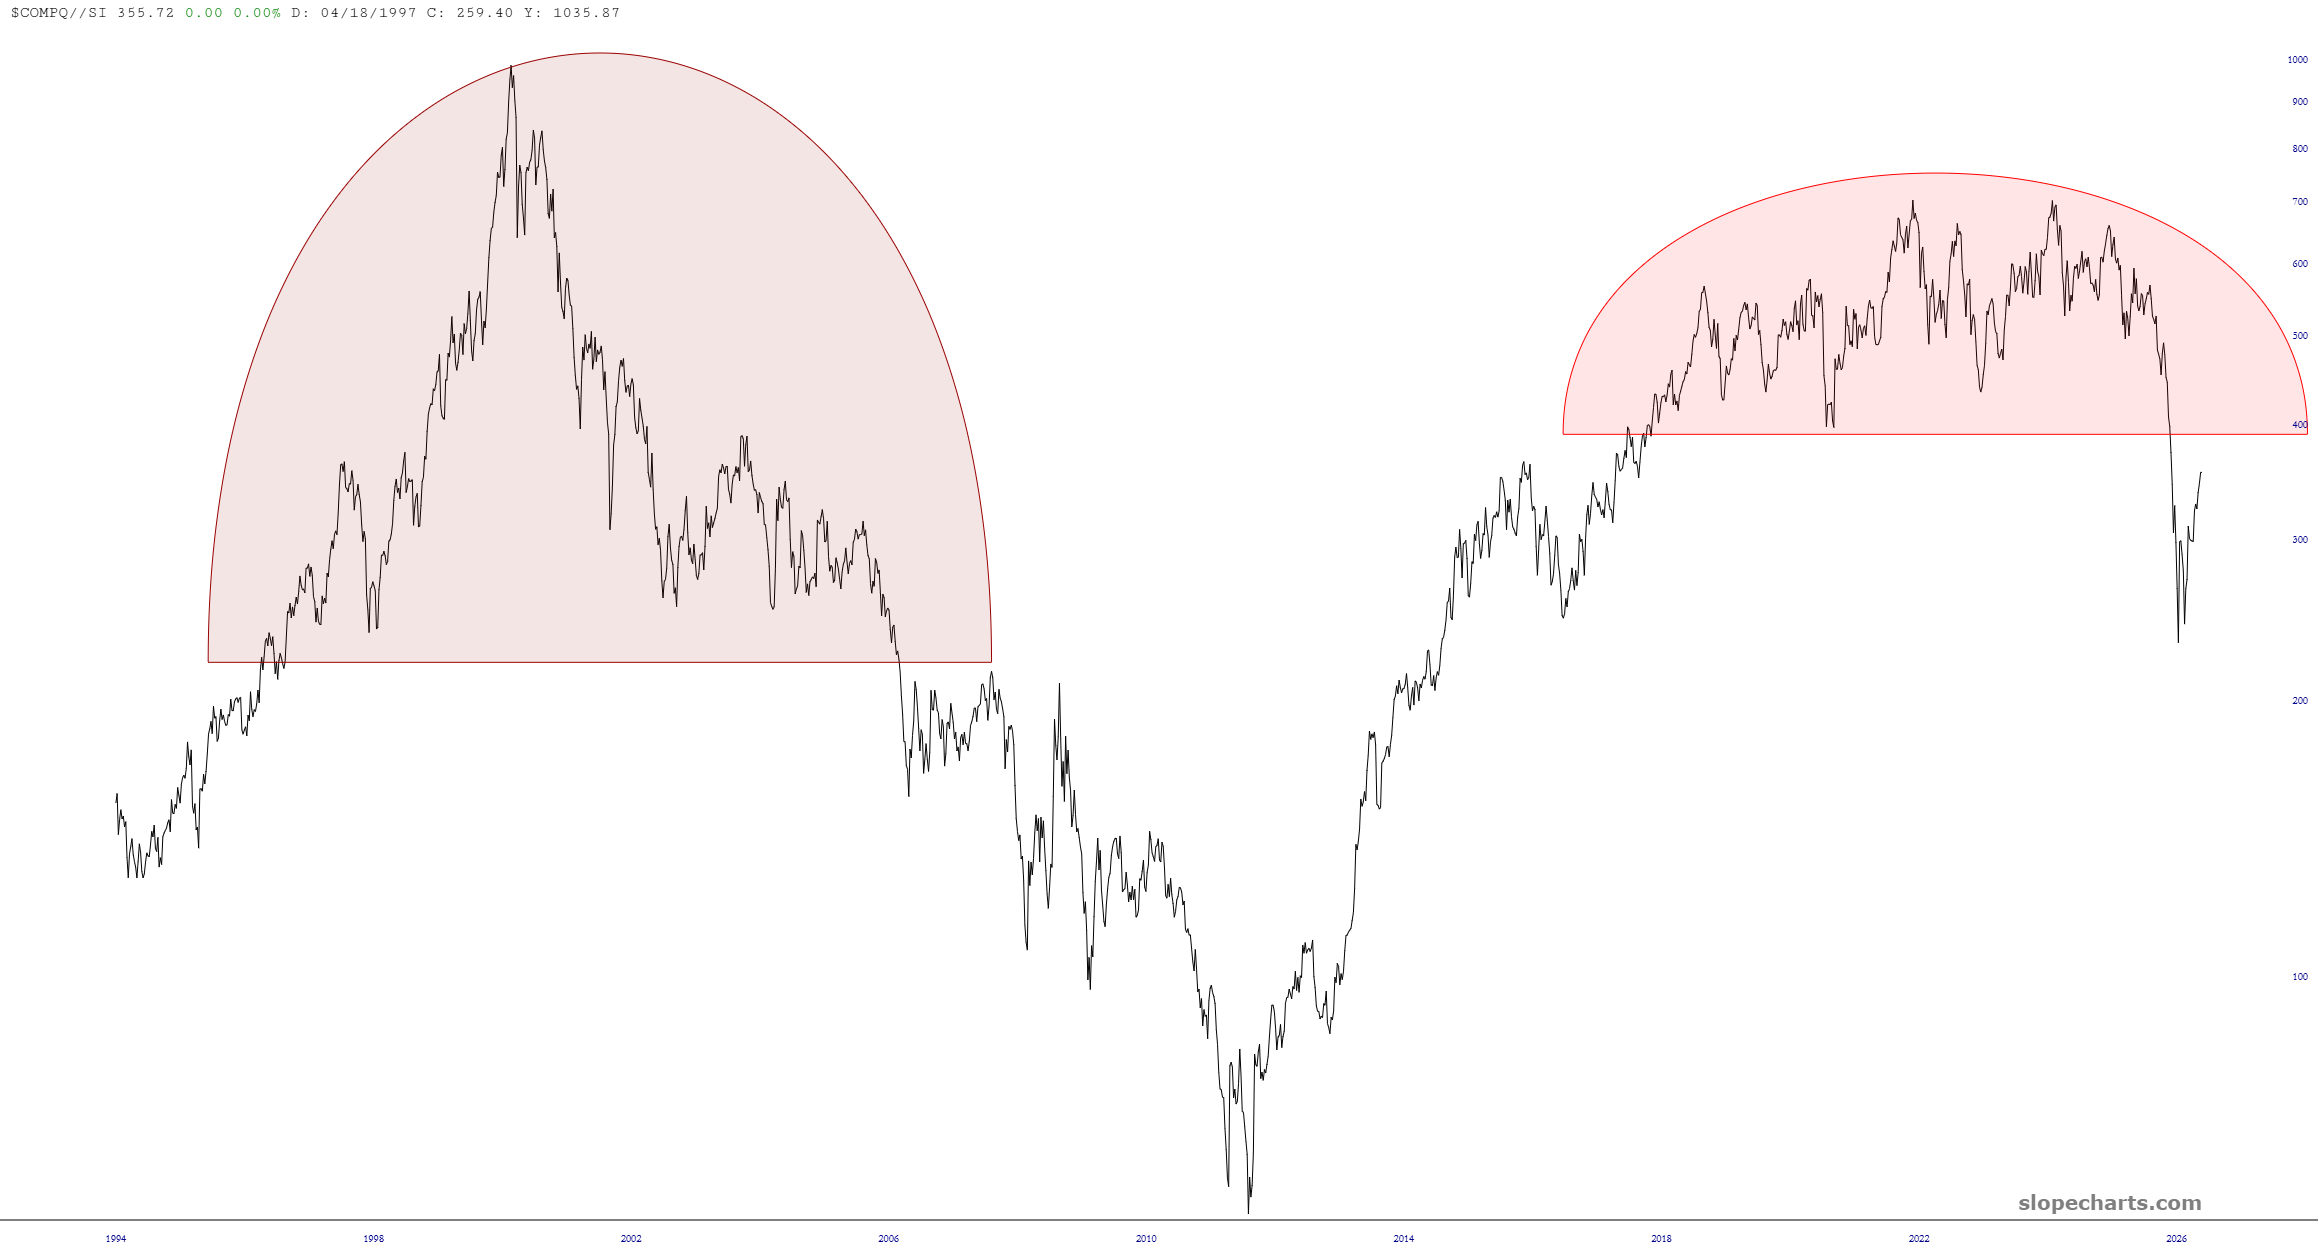
The pairs charts, or ratio charts, that I follow are favorites of mine, because they can provide insights that aren’t possible with simple single symbol charts. I have placed various thoughts about them in the caption area of each one.
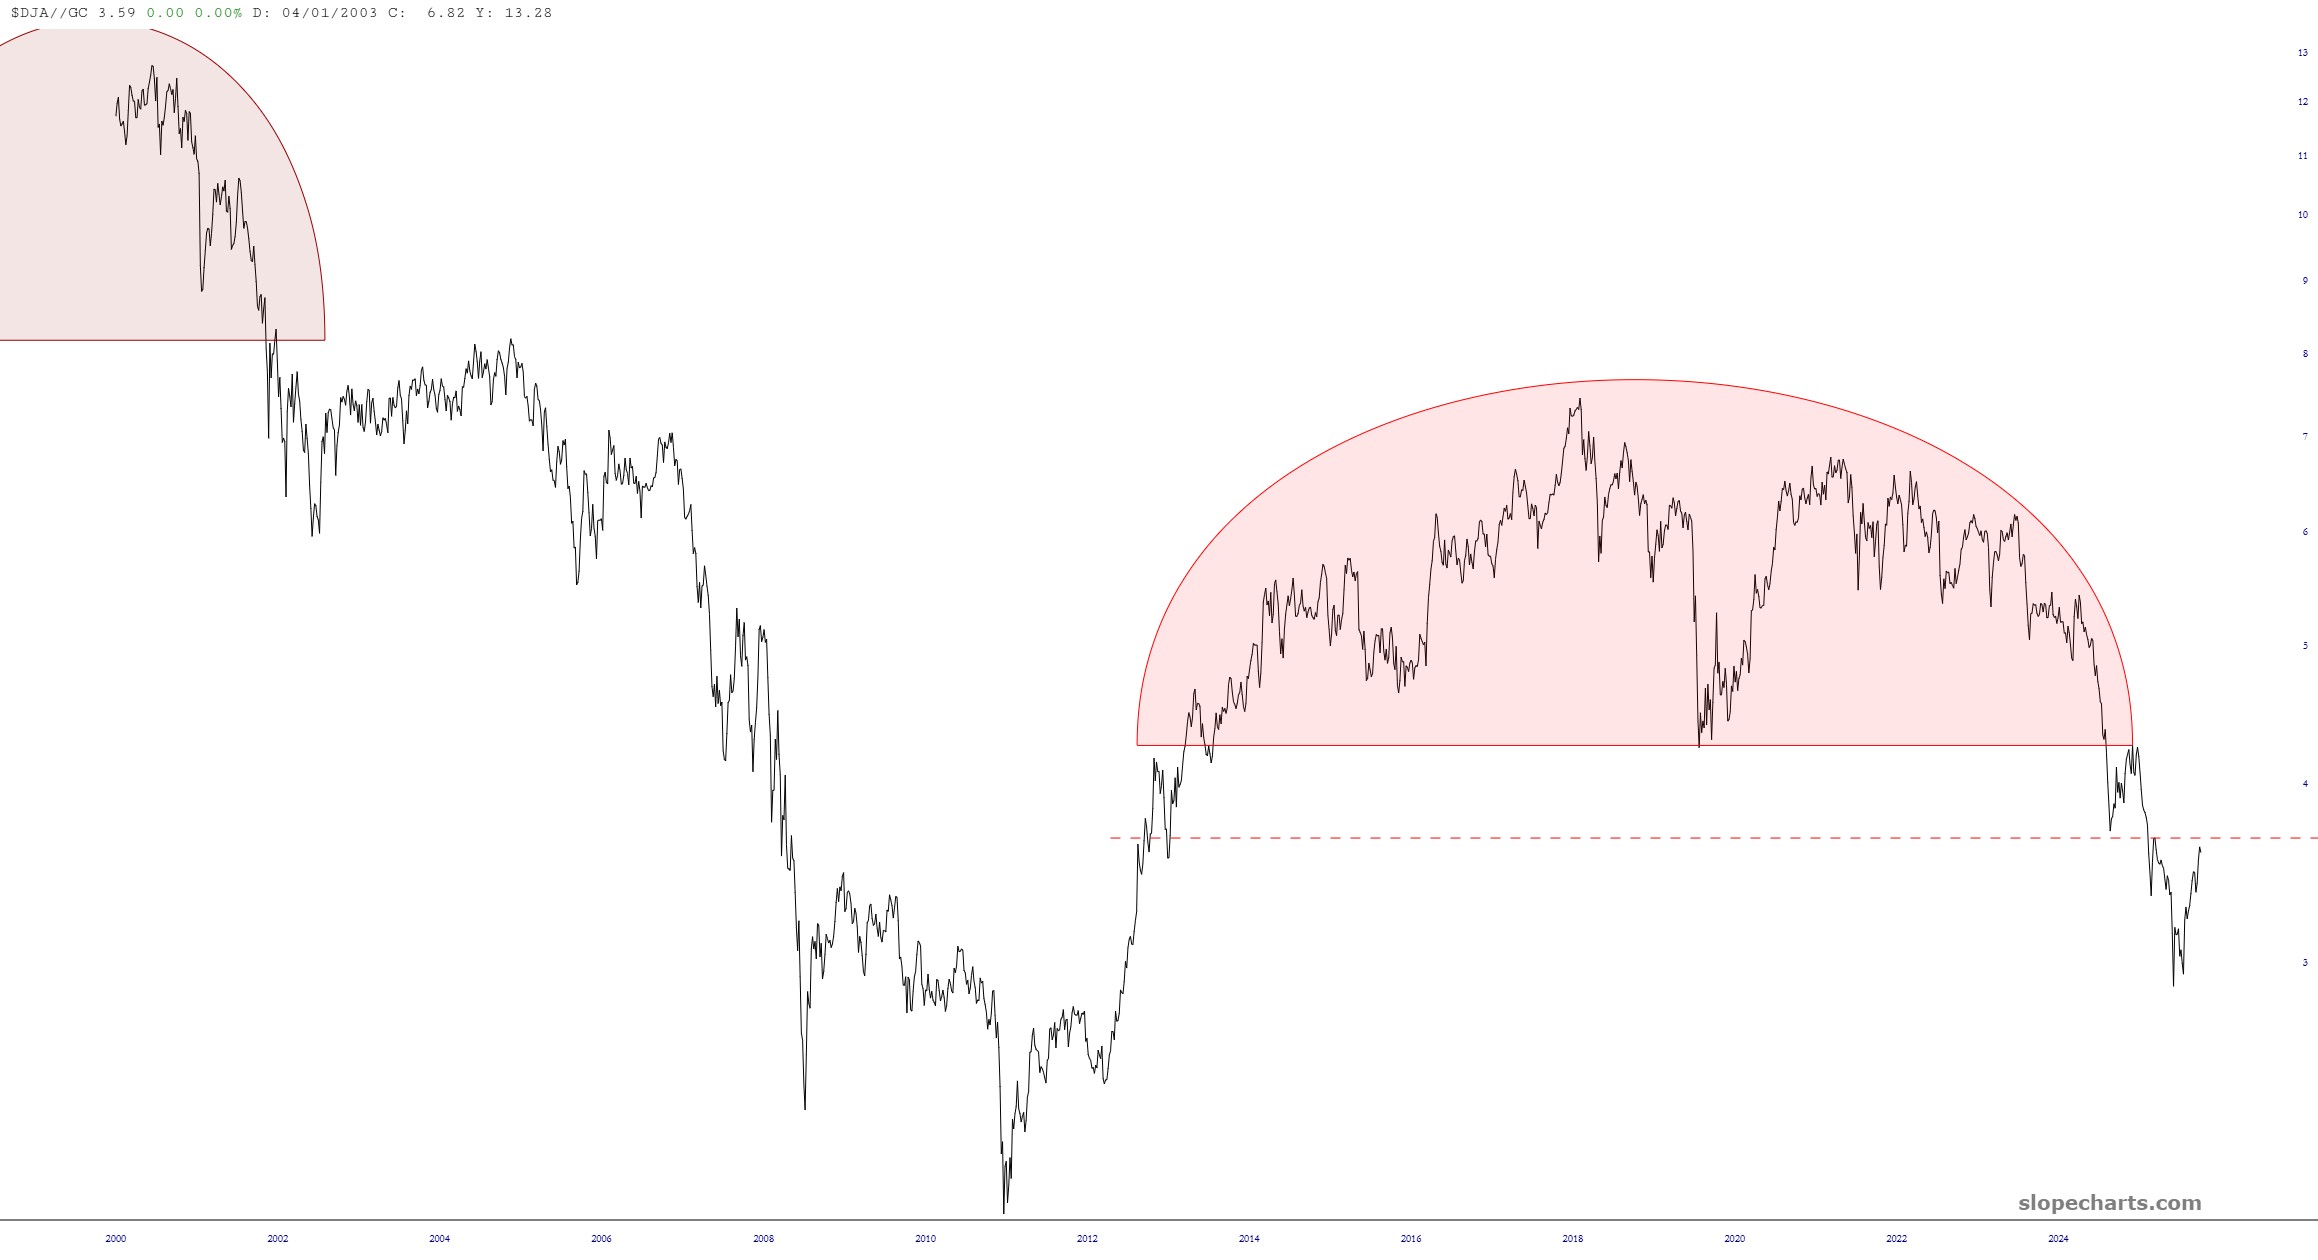
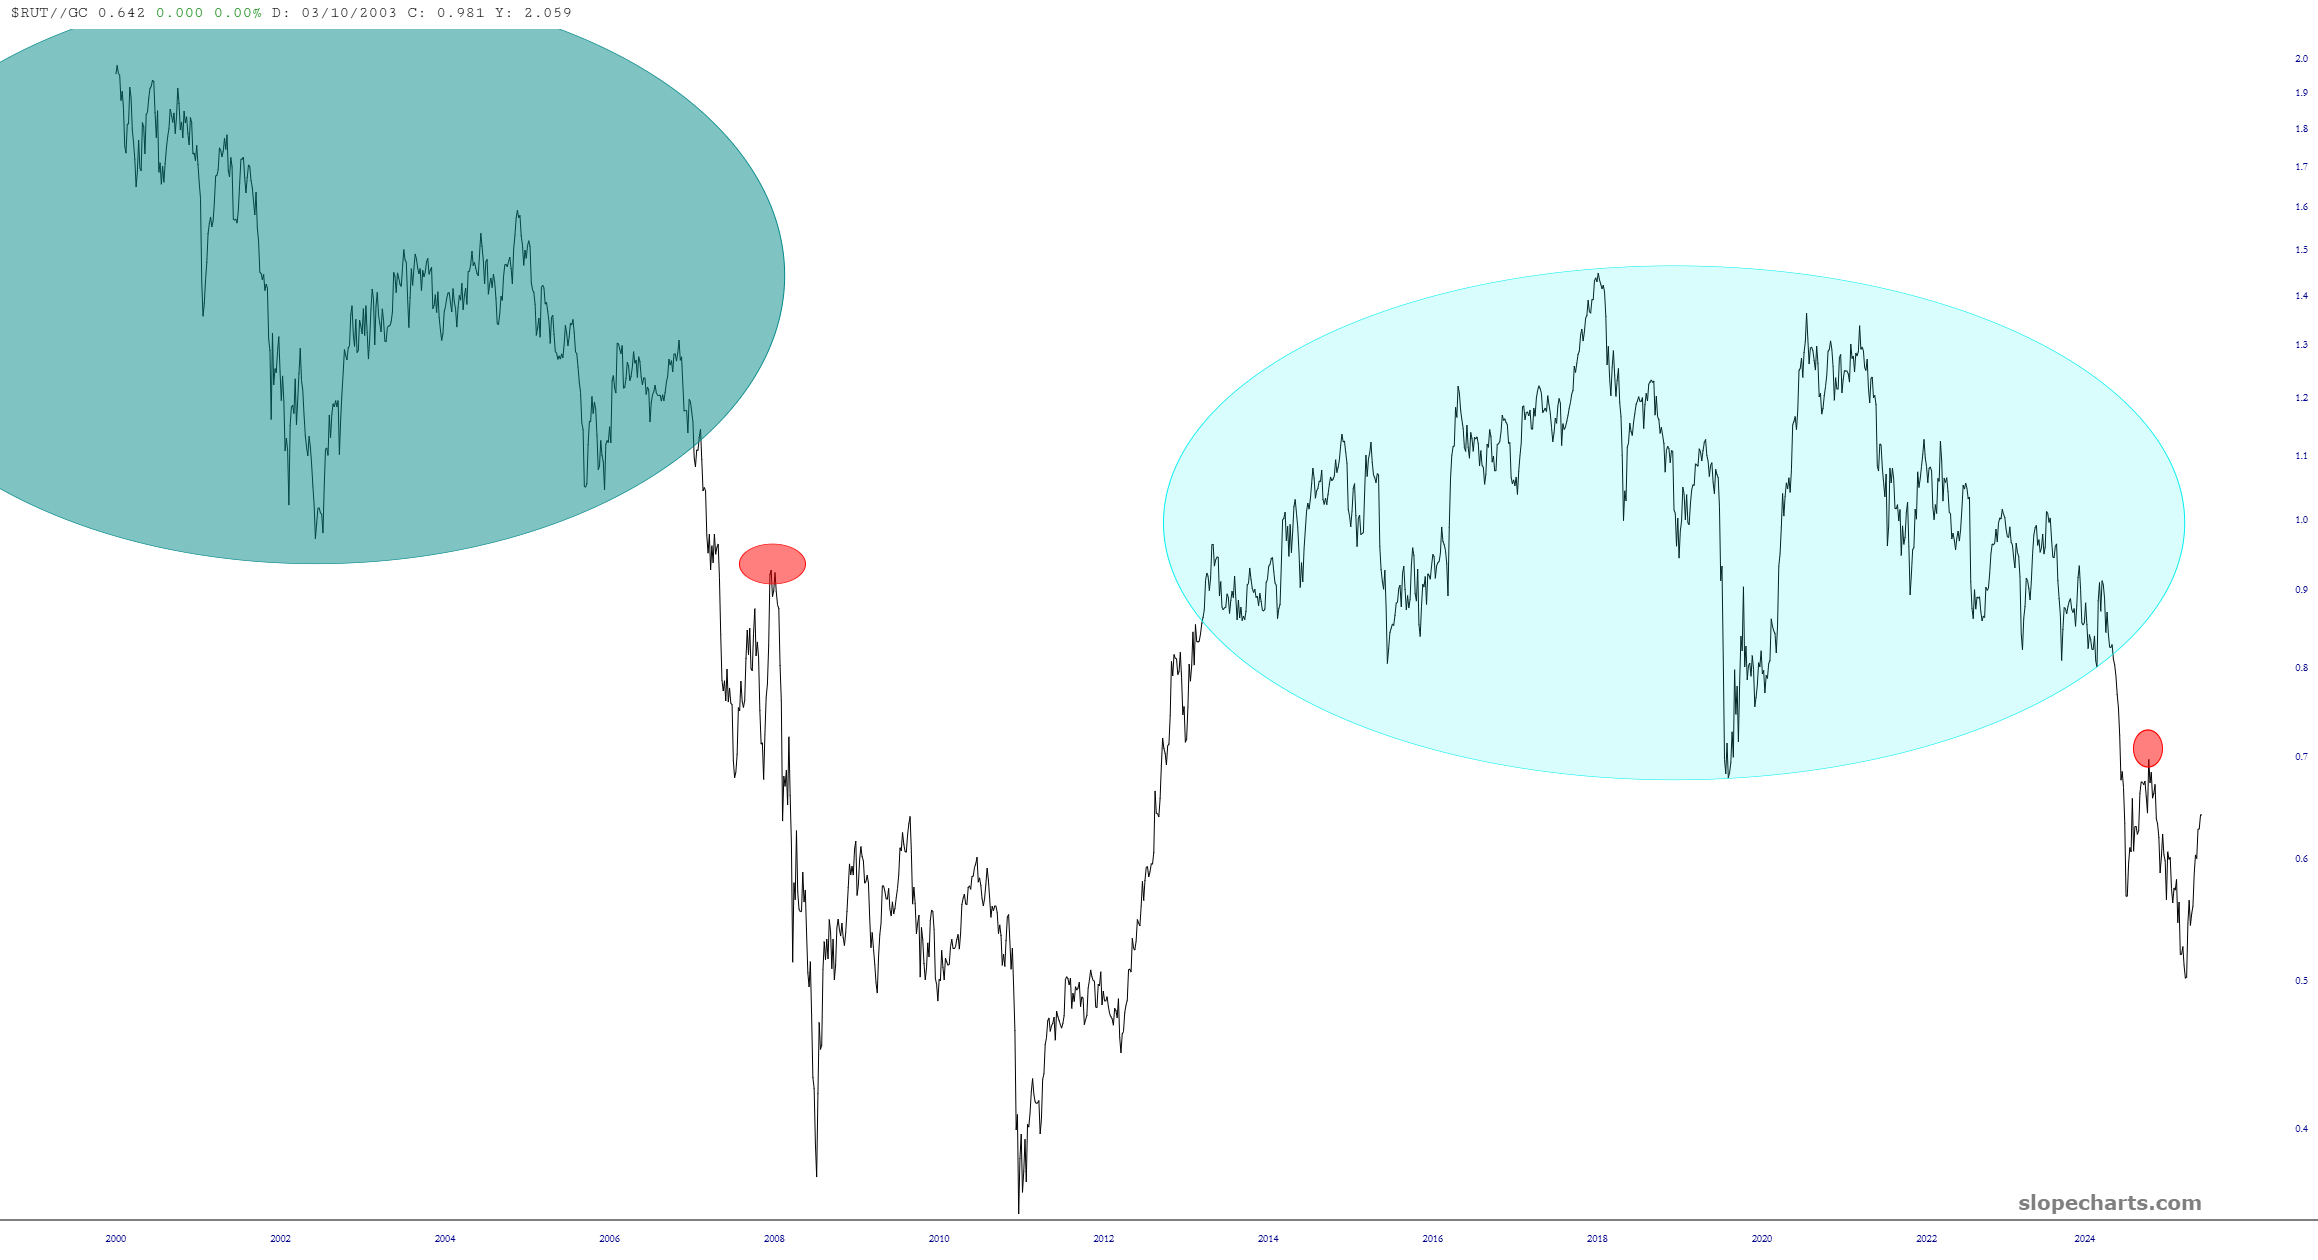
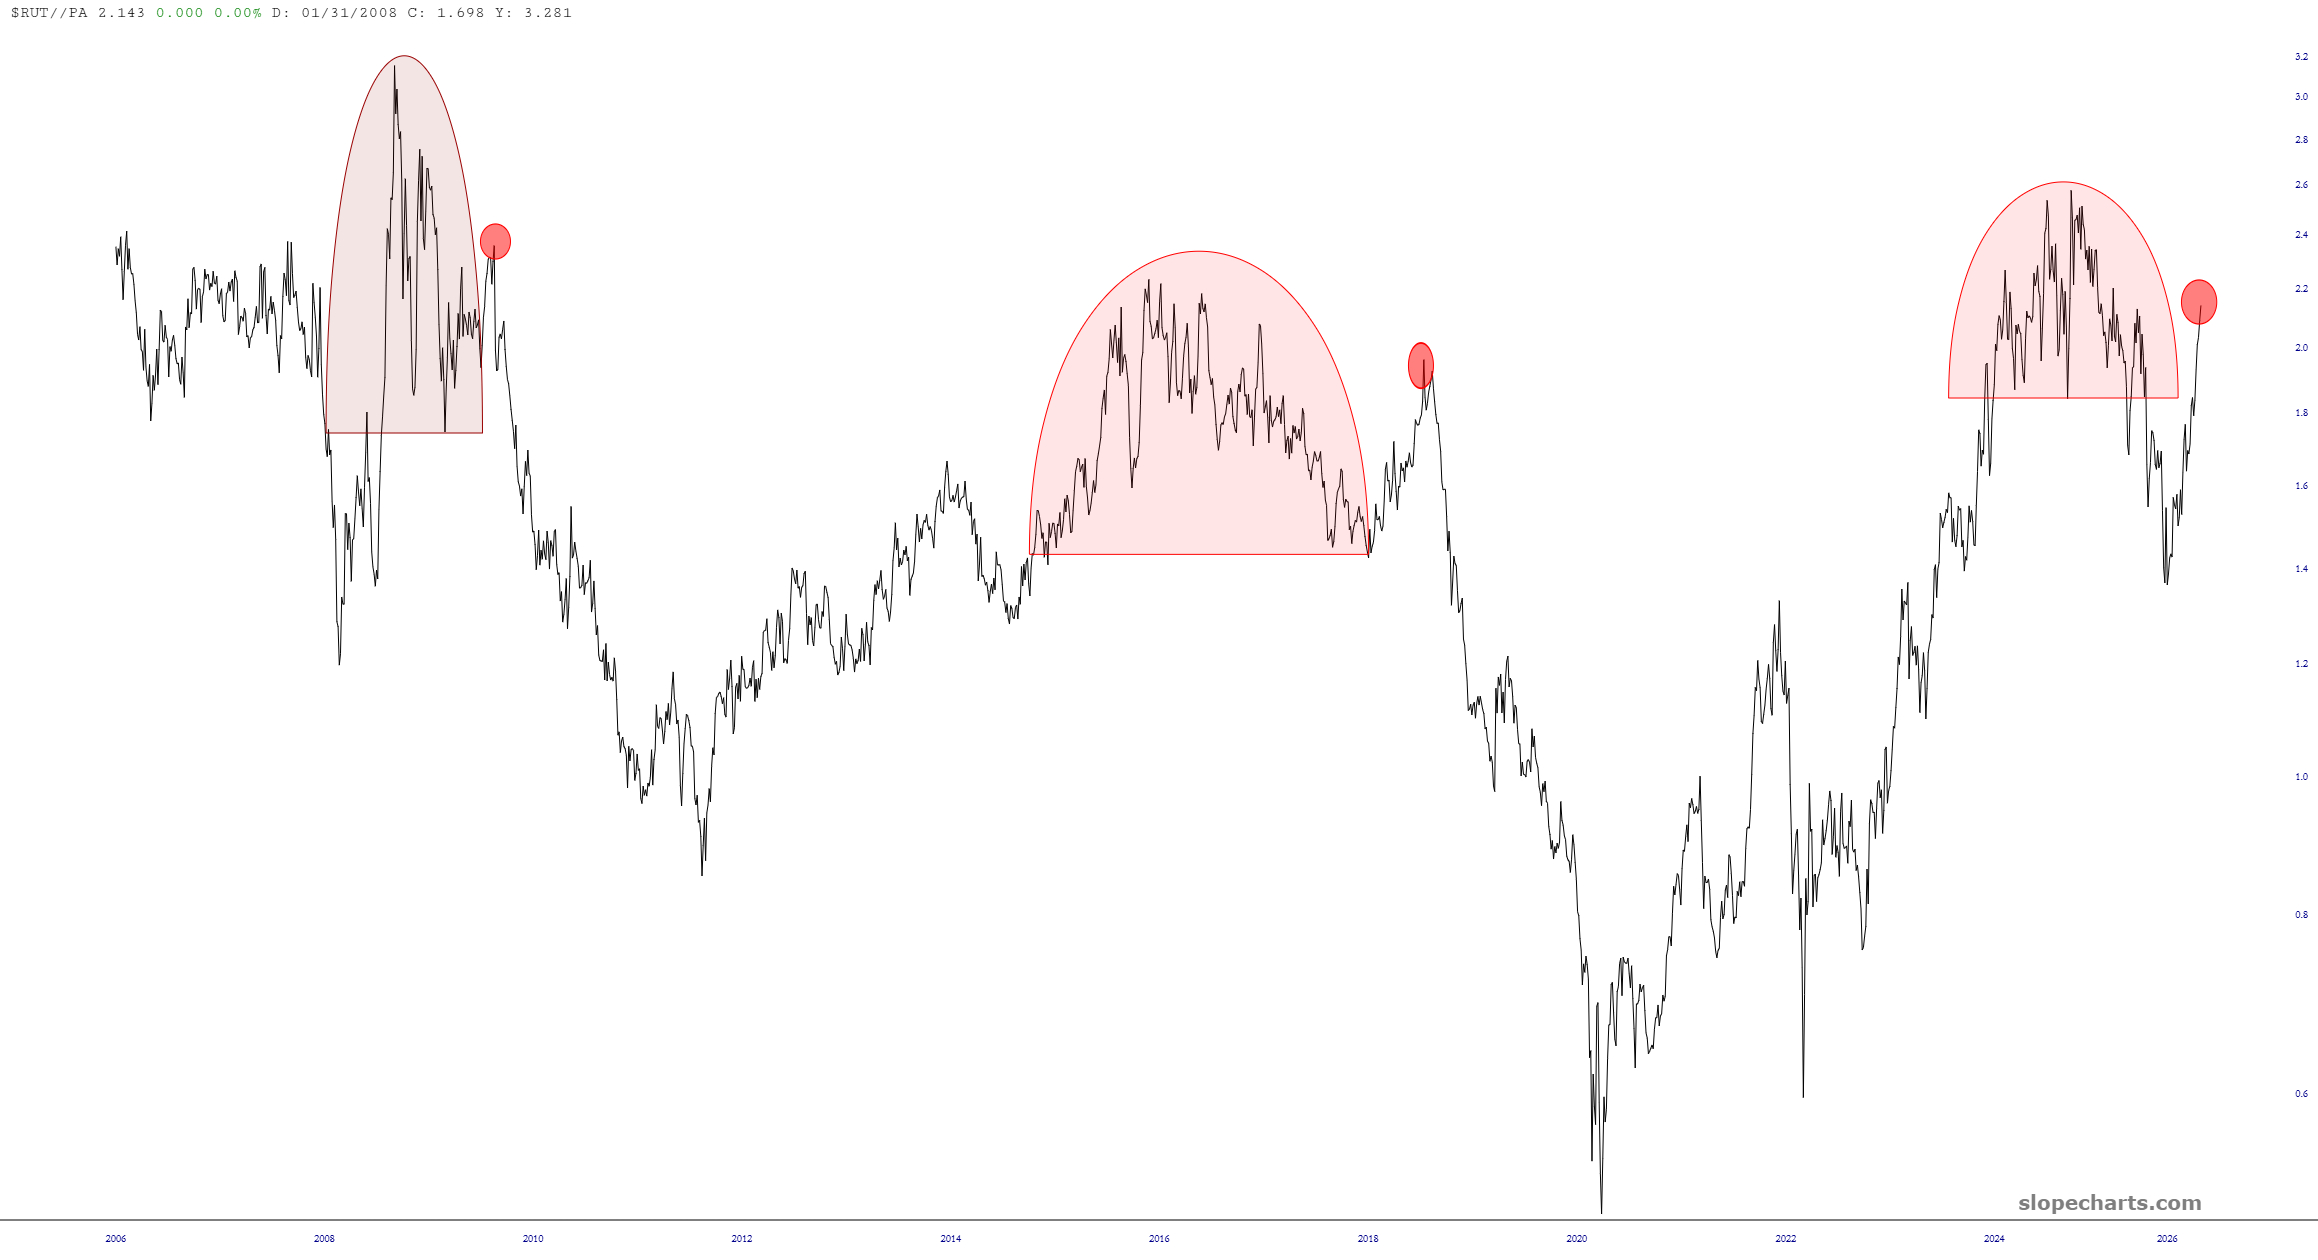
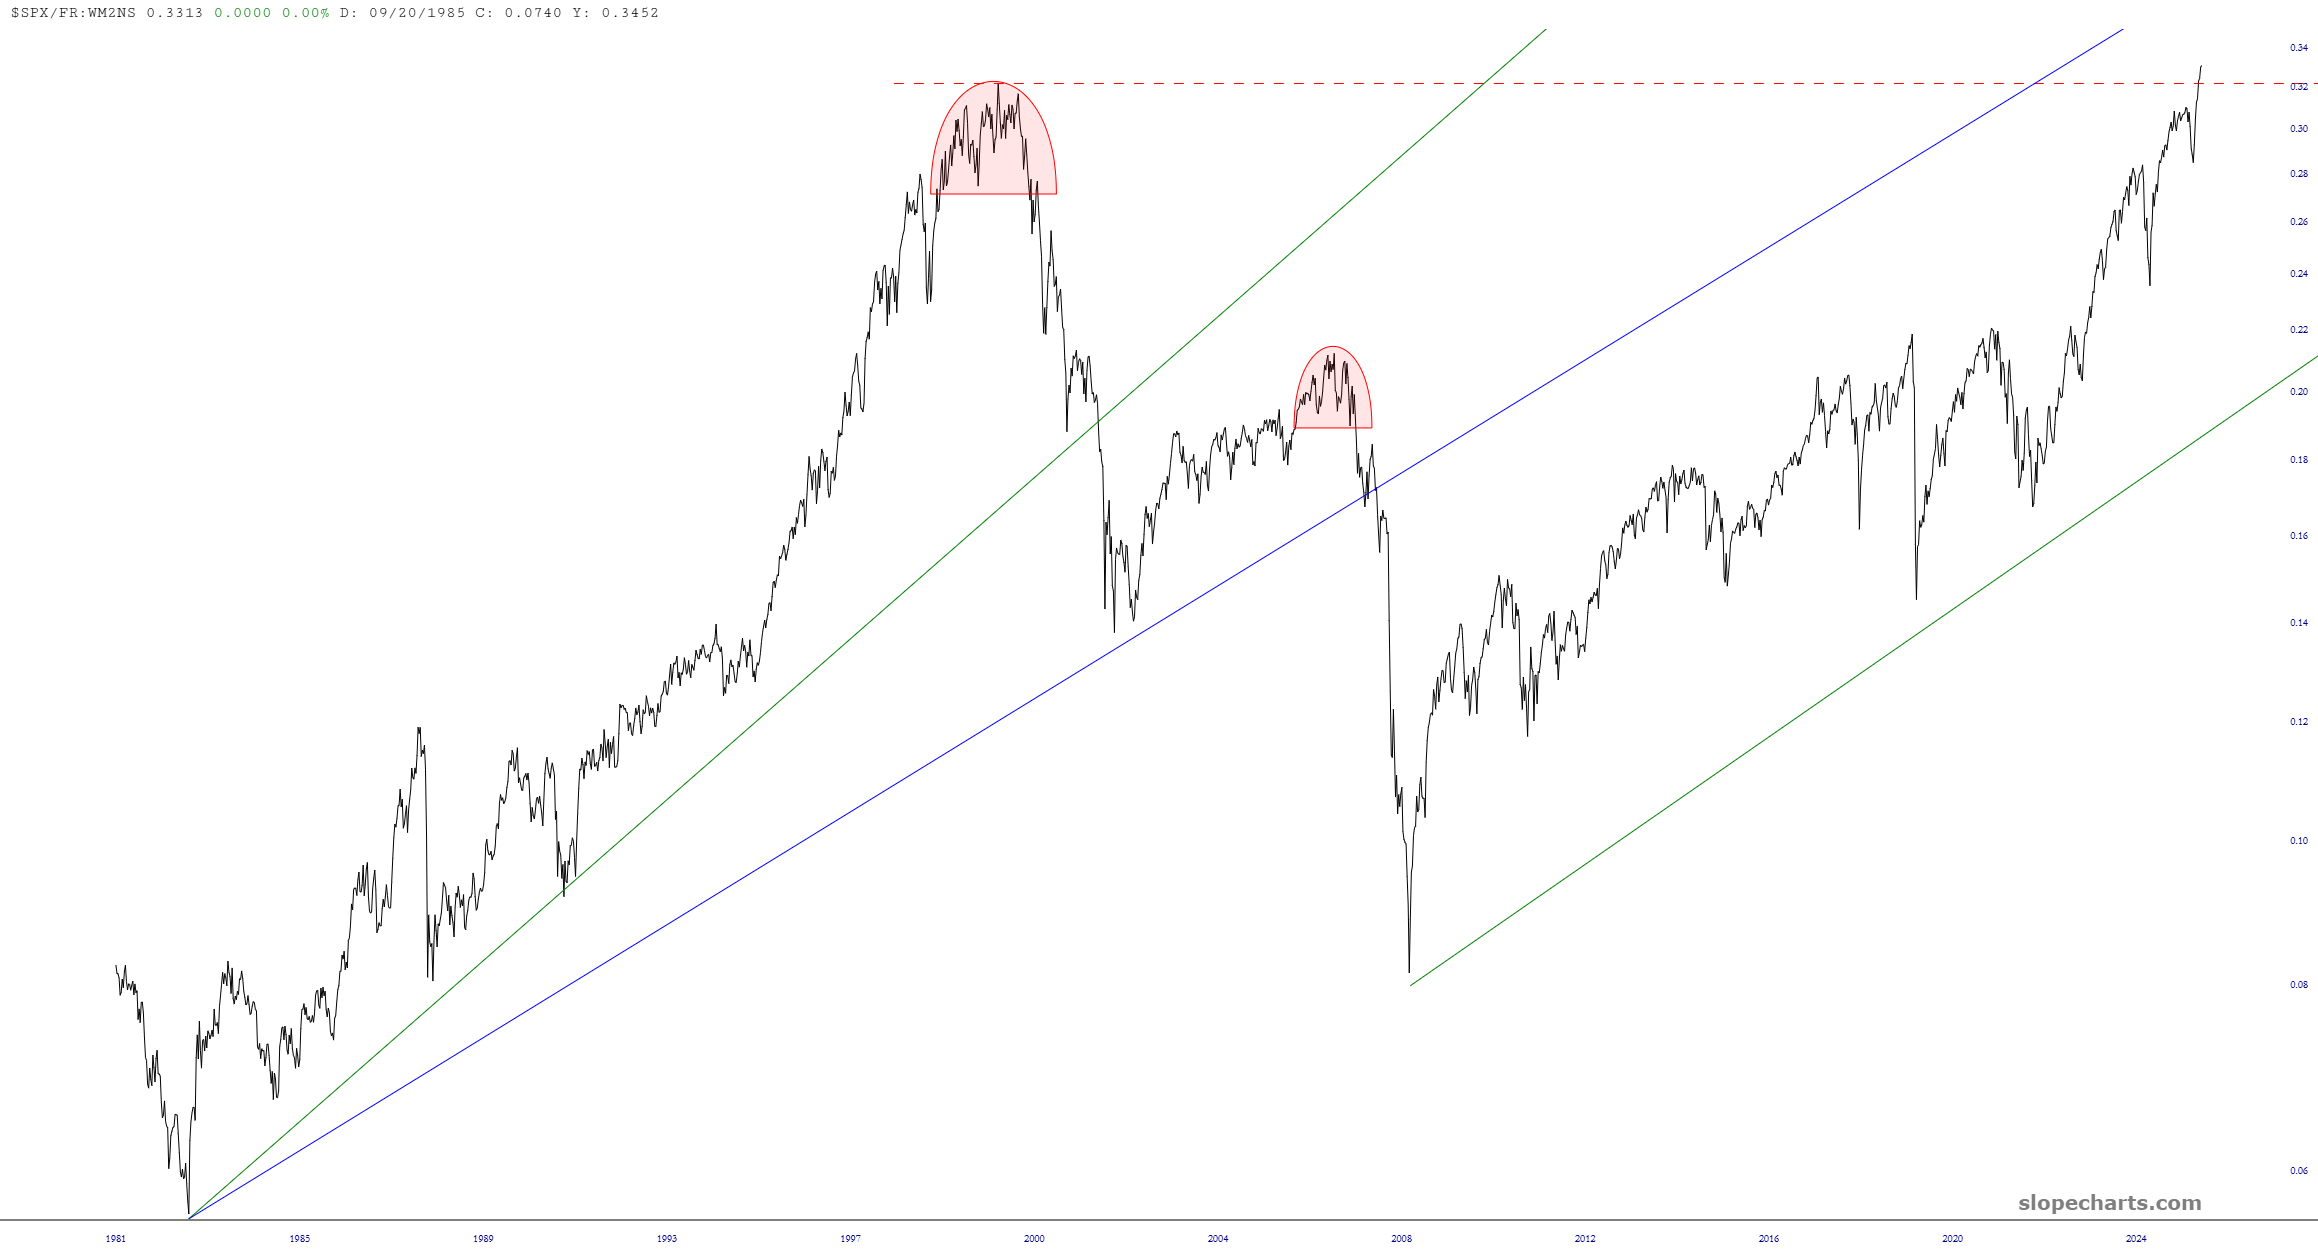
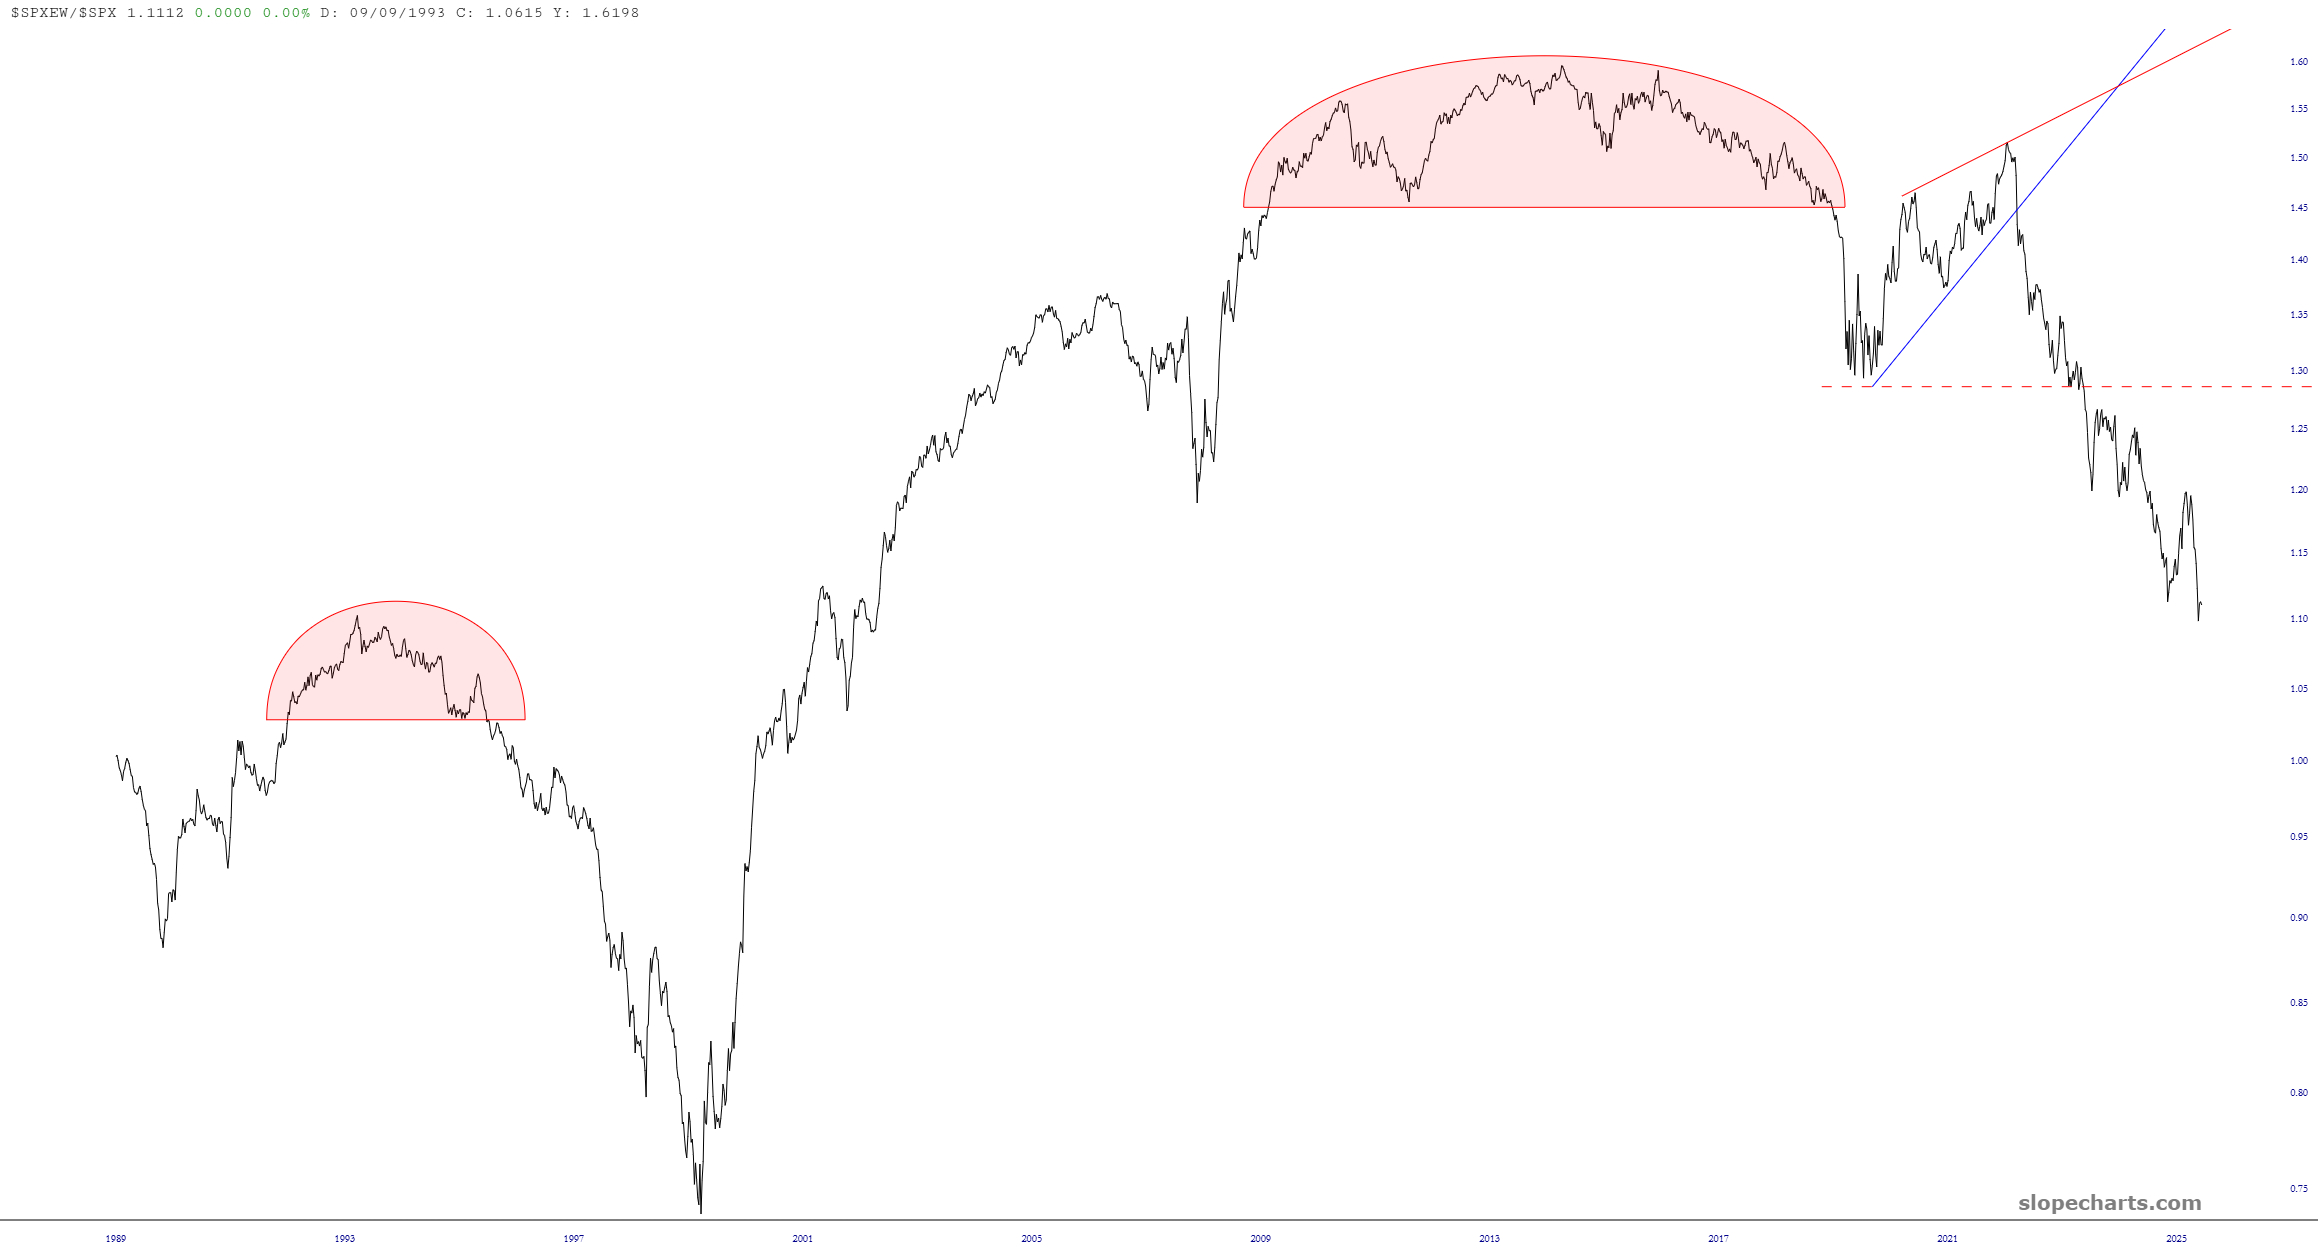
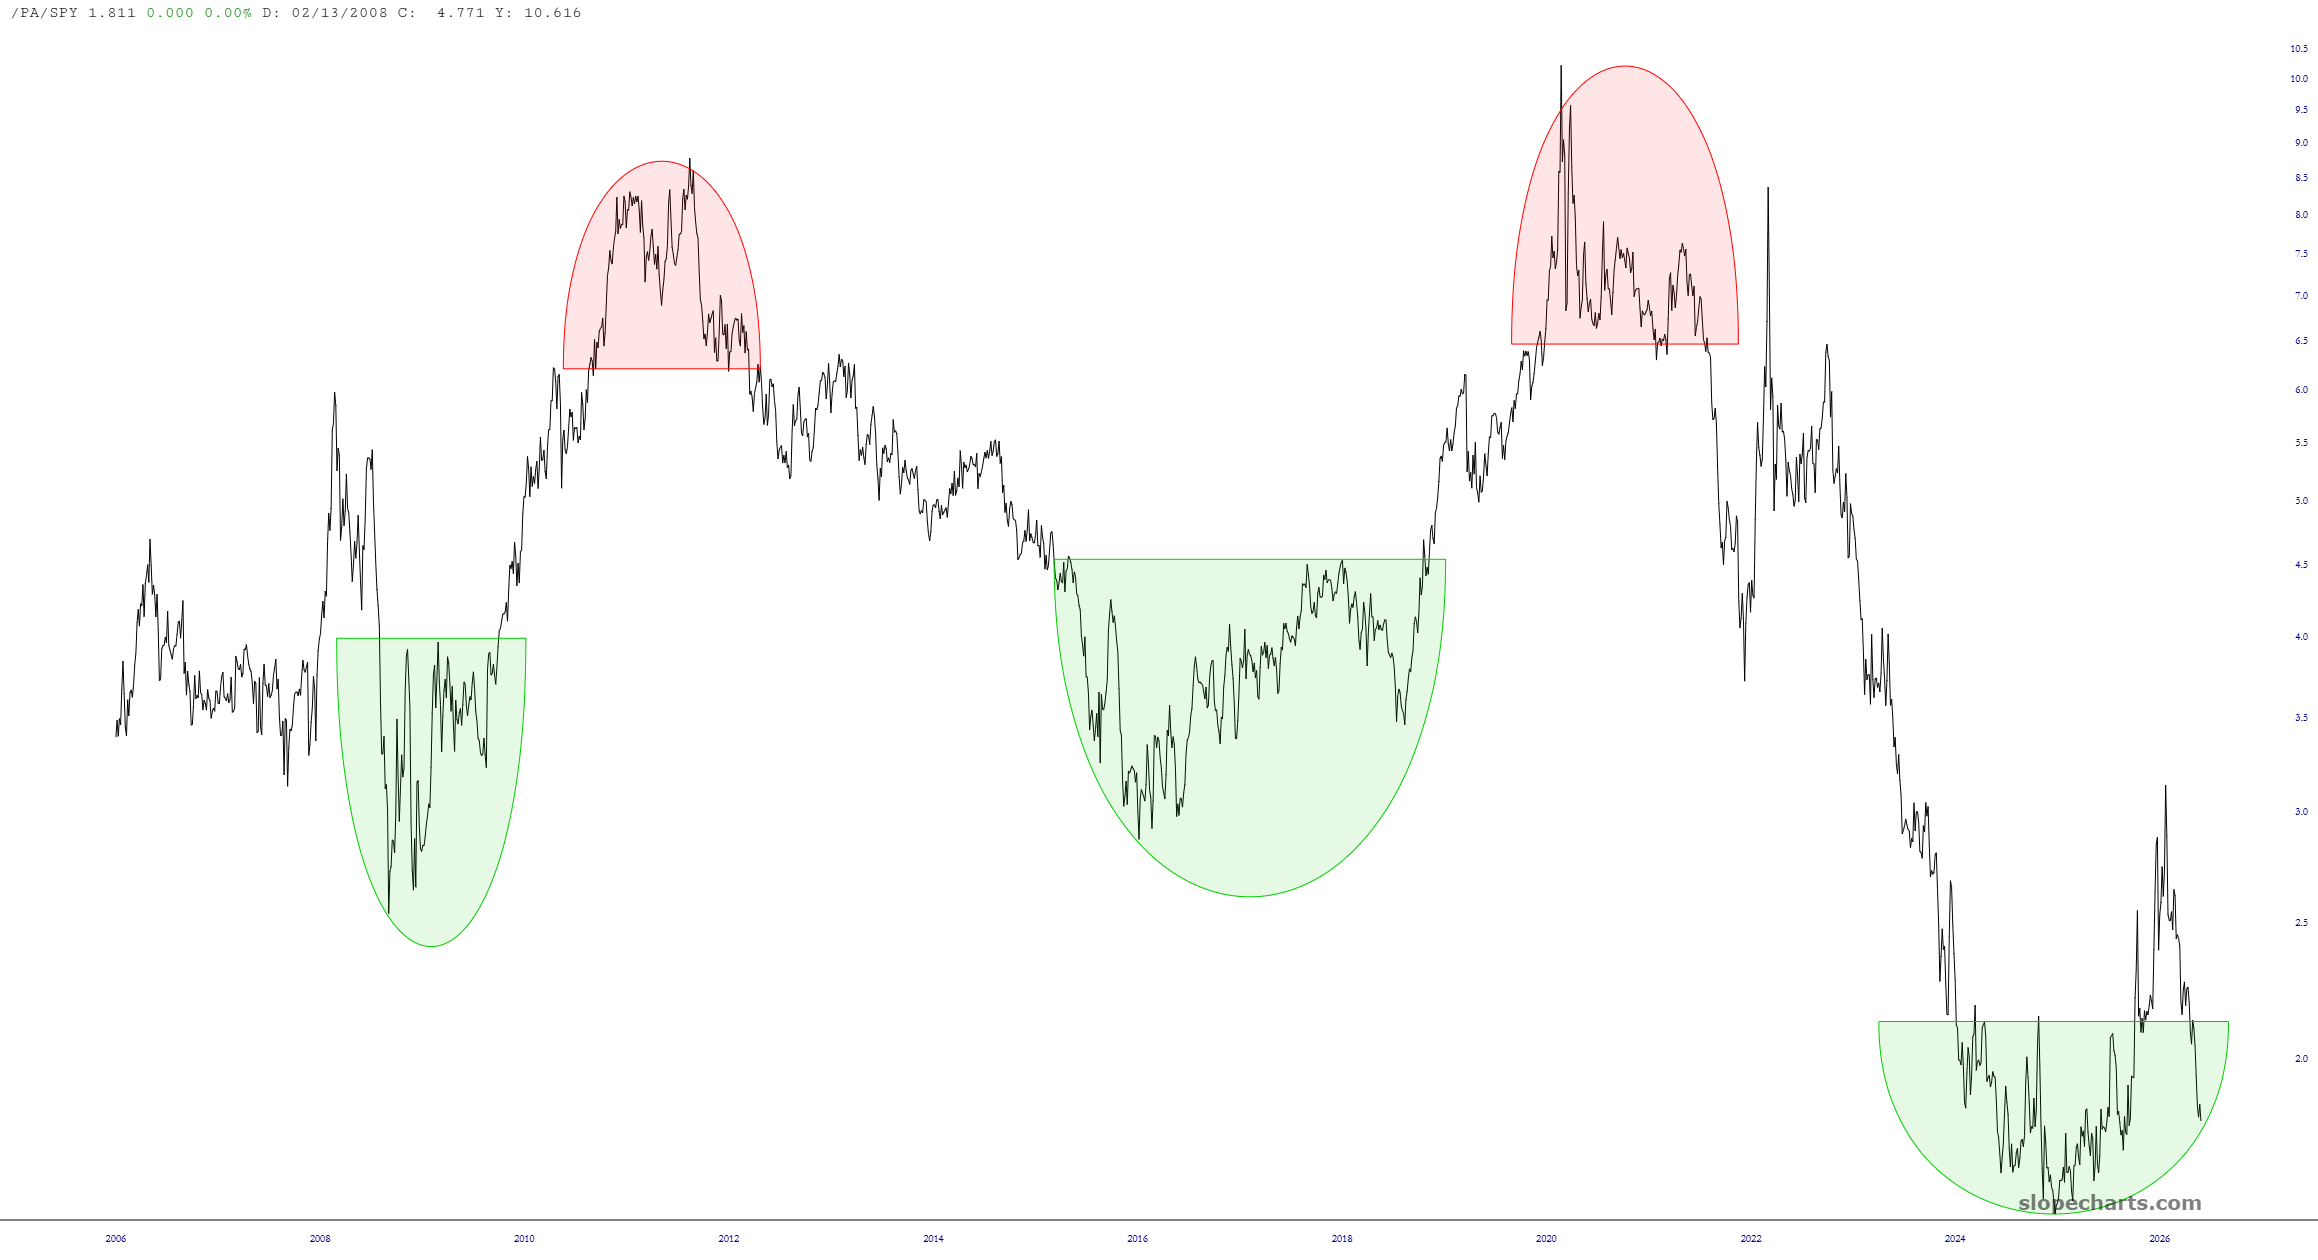
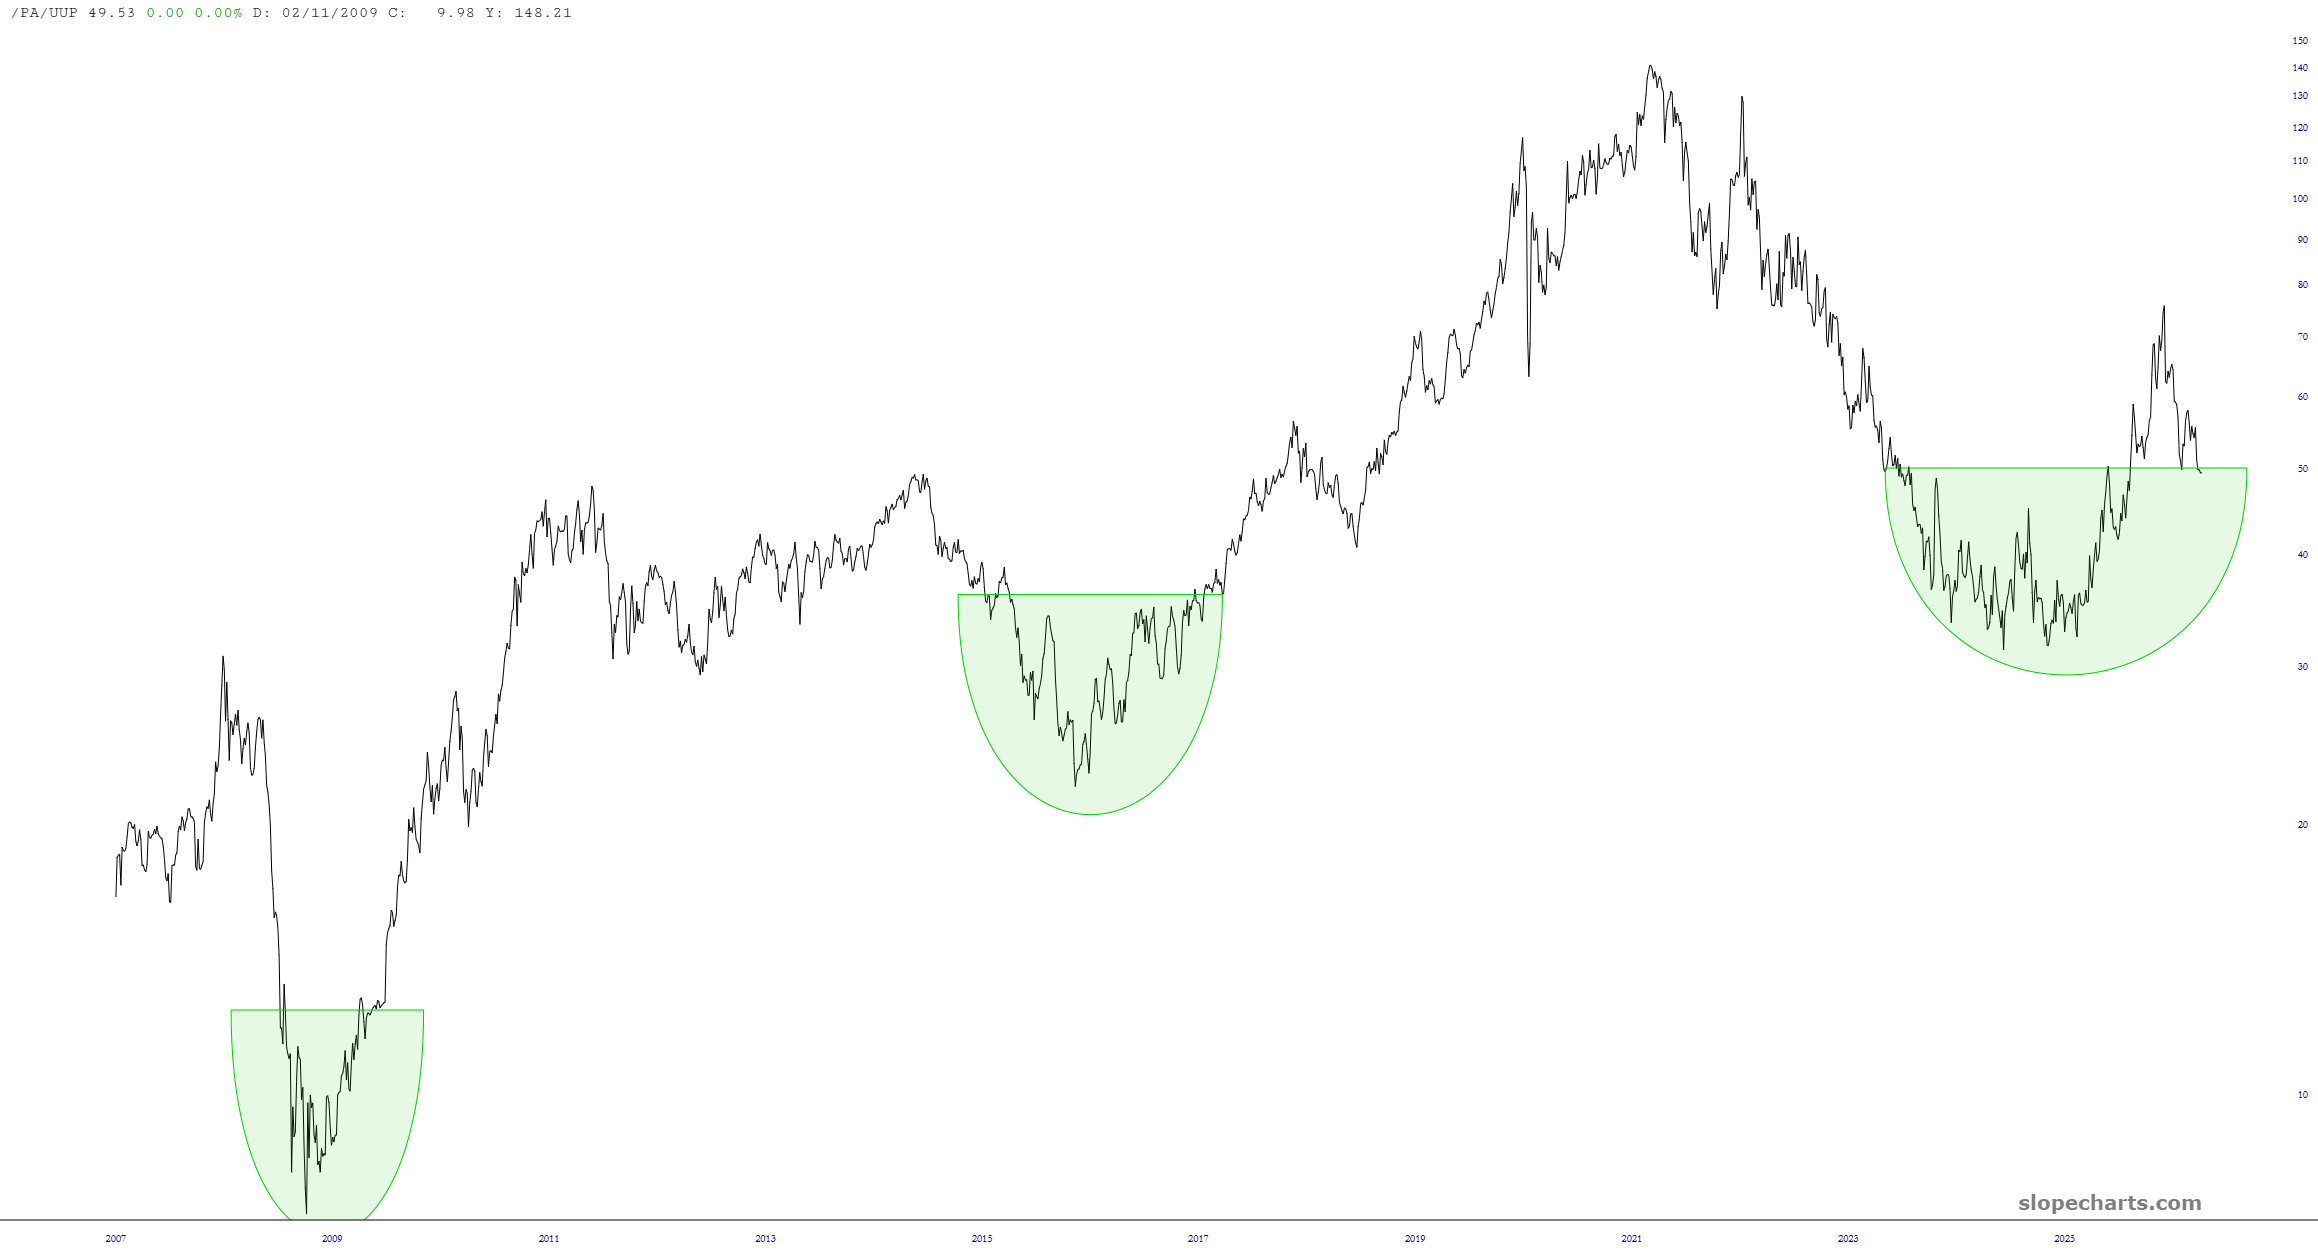
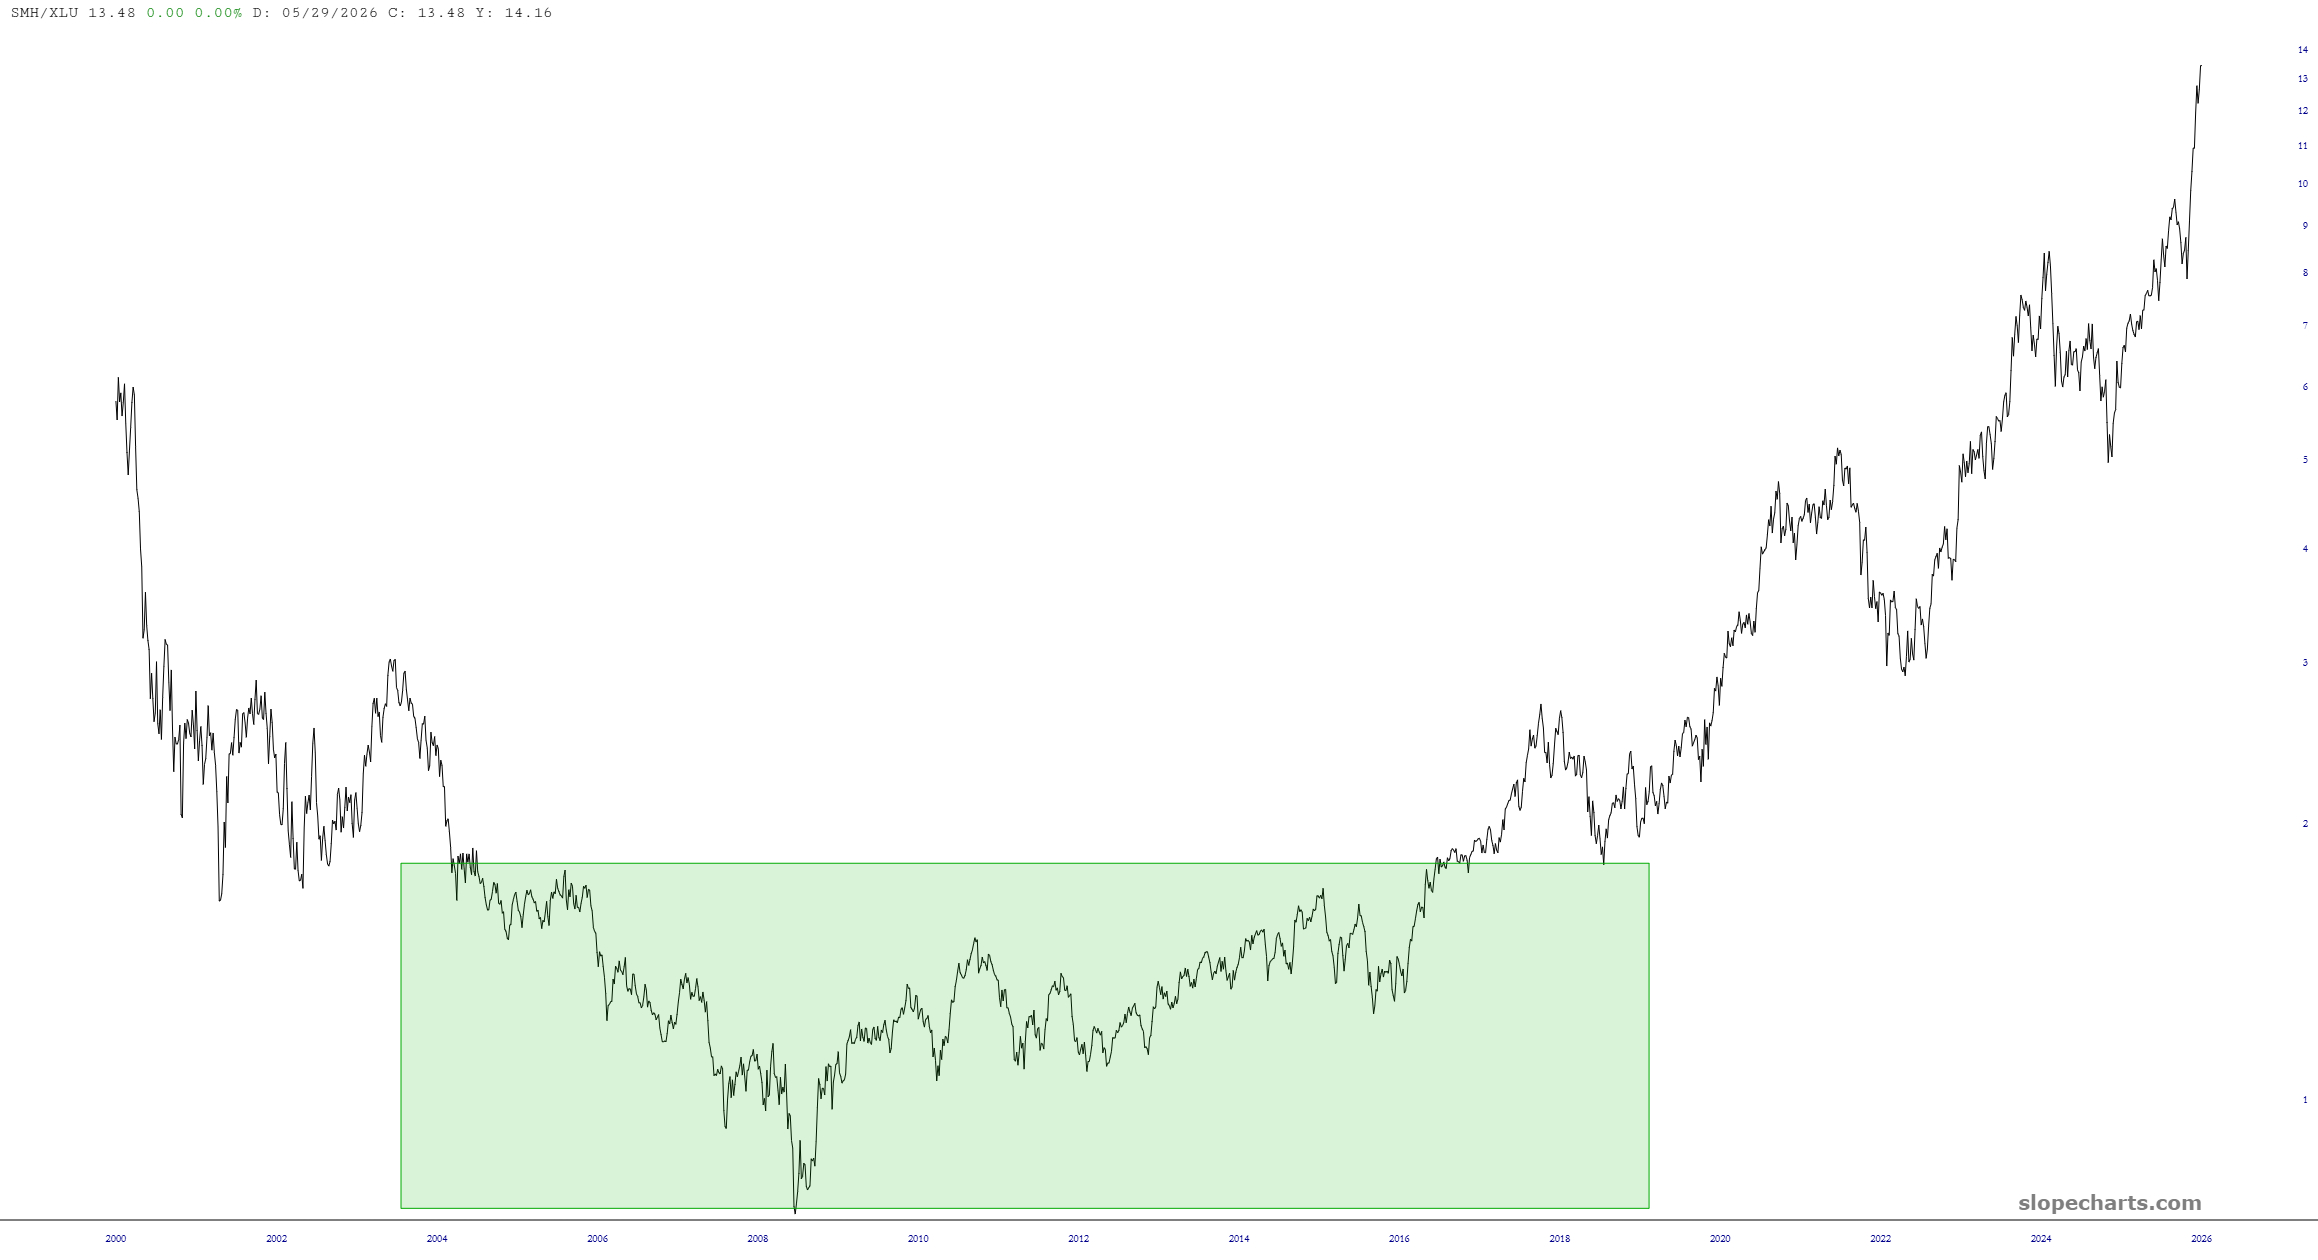
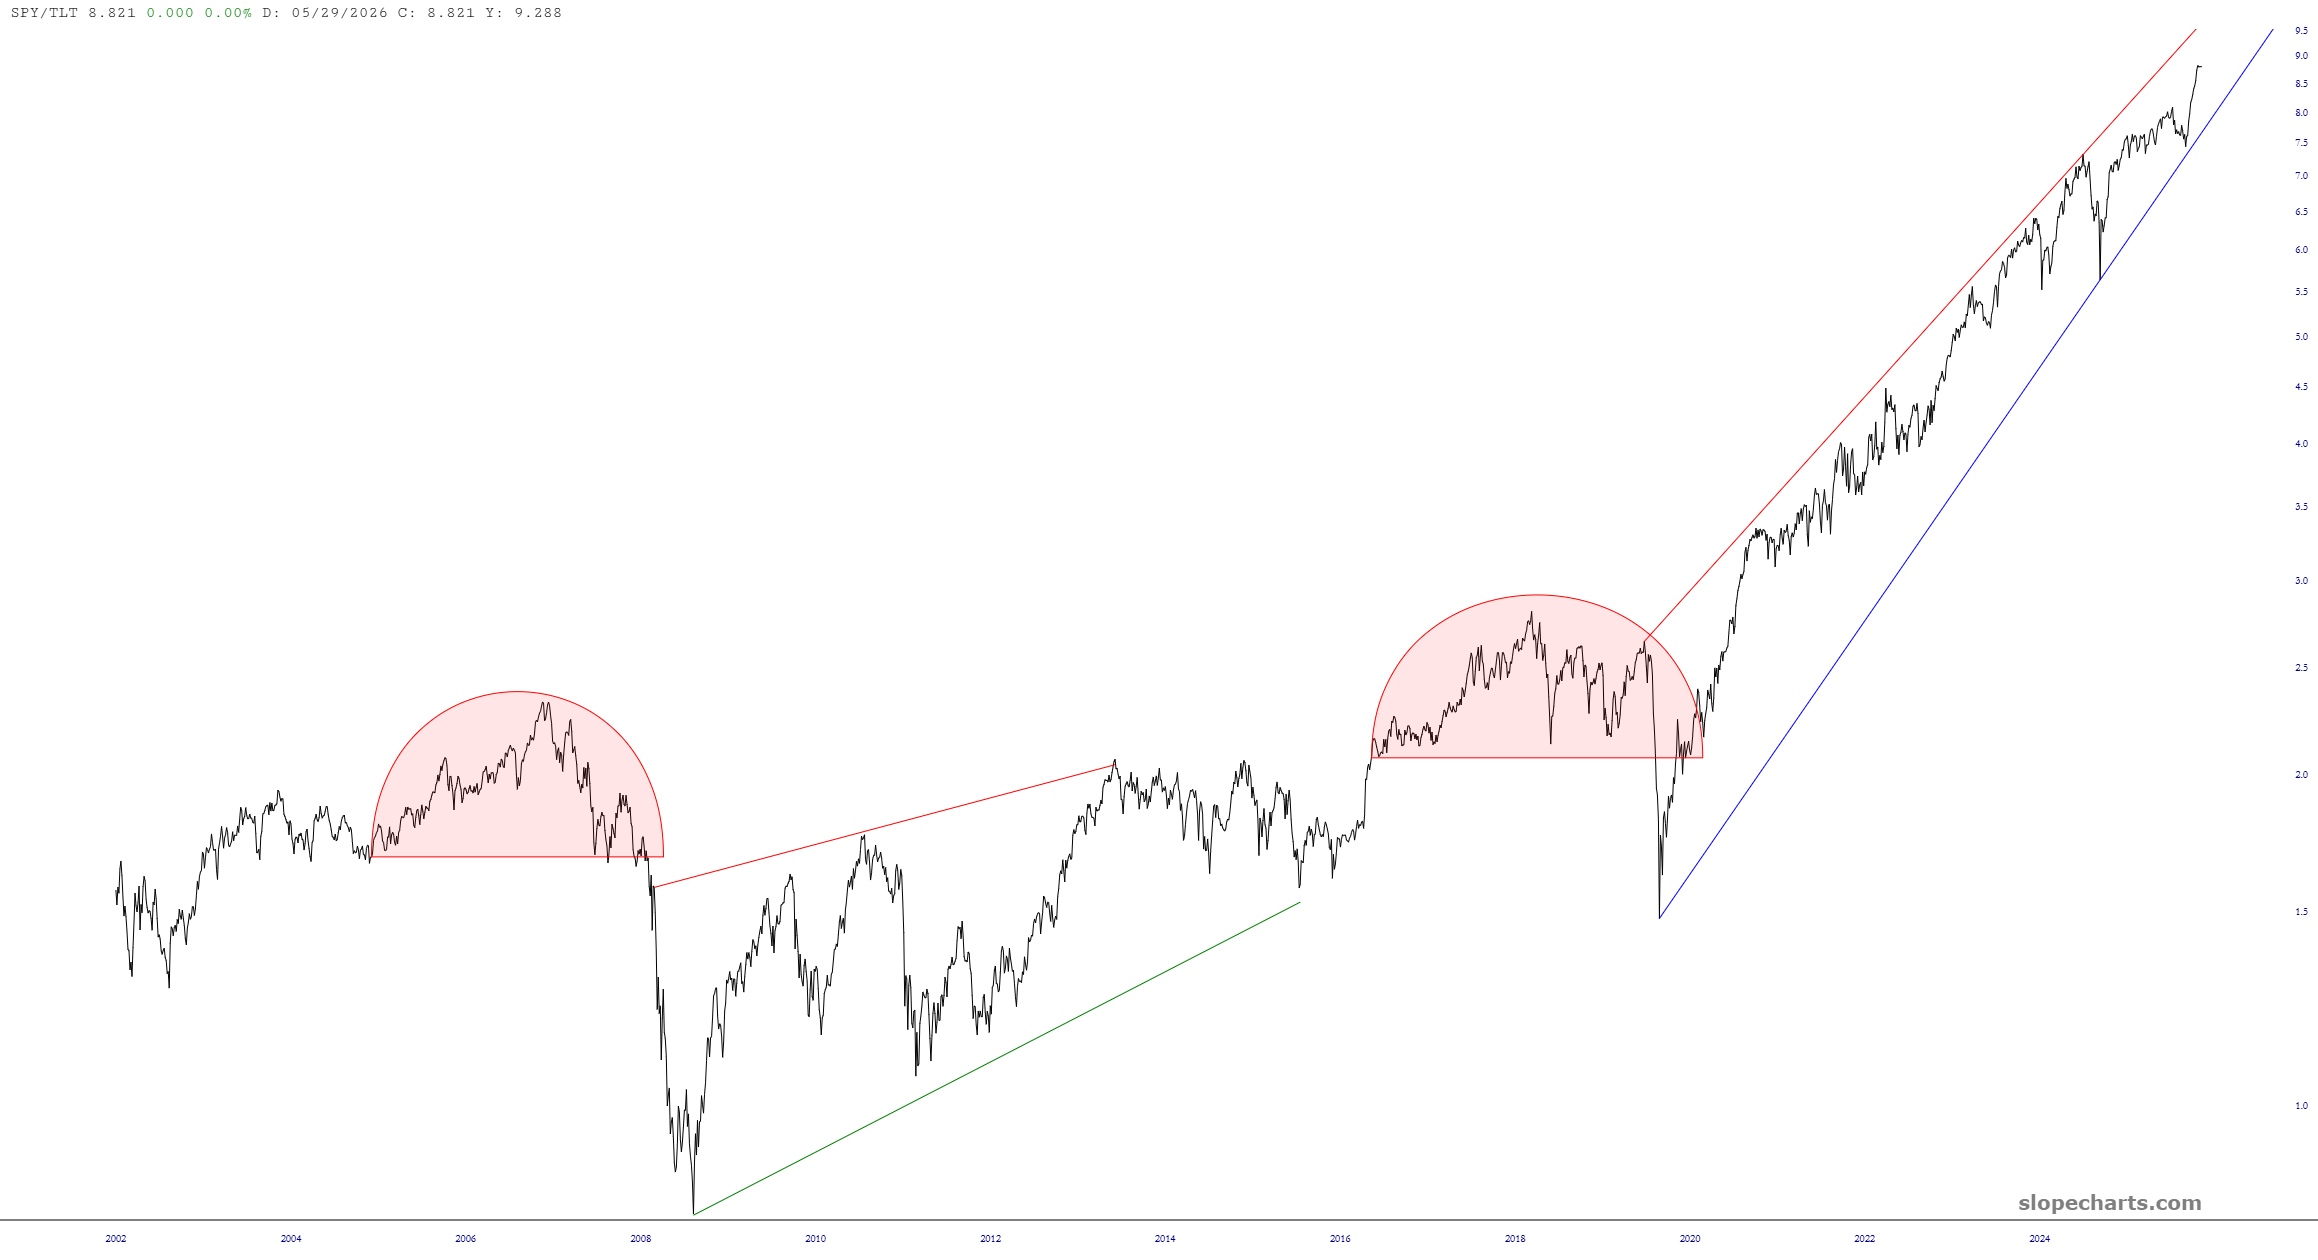
NASDAQ Composite divided by Silver suggests that, long-term, silver is going to substantially beat tech stocks.Dow Industrials divided by Gold is a long-completed pattern, and its recent strength has come up to a horizontal resistance line, suggesting that gold’s strength, and equity’s weakness, is about to resume.A similar chart with the same conclusion, the Russell 2000 divided by silver, is especially interesting since the recent counter-trend rally marks merely a “lower high”; take special note of the red tinted area next to the similar patterns.The Russell 2000 divided by Palladium has three analog charts line up, each of which has a powerful retracement which exhausts itself at the red circle. Palladium has been weak for months, but its price position relative to stocks indicates it might be time for palladium to rally strongly soon.Here we have the S&P 500 normalized by the M2 money supply. This is striking since the value has exceeded even the madness of the Internet bubble, reaching the highest point ever recorded in market history.The equal-weighted S&P divided by the normal S&P has been falling for years, illustrating how just a handful of mega-caps have been providing the majority of power to the rallyHere’s another argument for a palladium rally, which is palladium divided by the SPY, which is deep inside its bullish base.And yet another bullish chart for palladium, which is the metal divided by the U.S. dollar index. This is the third basing pattern, the prior two of which were followed by substantial rallies.For a look at relative strength, the ratio chart of SMH divided by XLU is higher than a kite right now, strongly suggesting that high-risk assets (like semiconductors, in this case) are relatively overvalued.Lastly, our old favorite SPY divided by TLT. Although it isn’t butting up against a trendline at this time, its value has never been higher.