
ES made good progress yesterday and made and exceeded my first upside target.We have now reached a level where we may see a big reversal to complete the possible H&S forming on the SPX chart. Will we see that reversal? I don’t know yet, but we are starting to see a significant reversal signaled by strong negative divergence on the 60min RSI. If rising support from the last low breaks, and that’s now in the 1555 ES area, then I’ll be looking for a retest of last week’s low to complete that H&S:
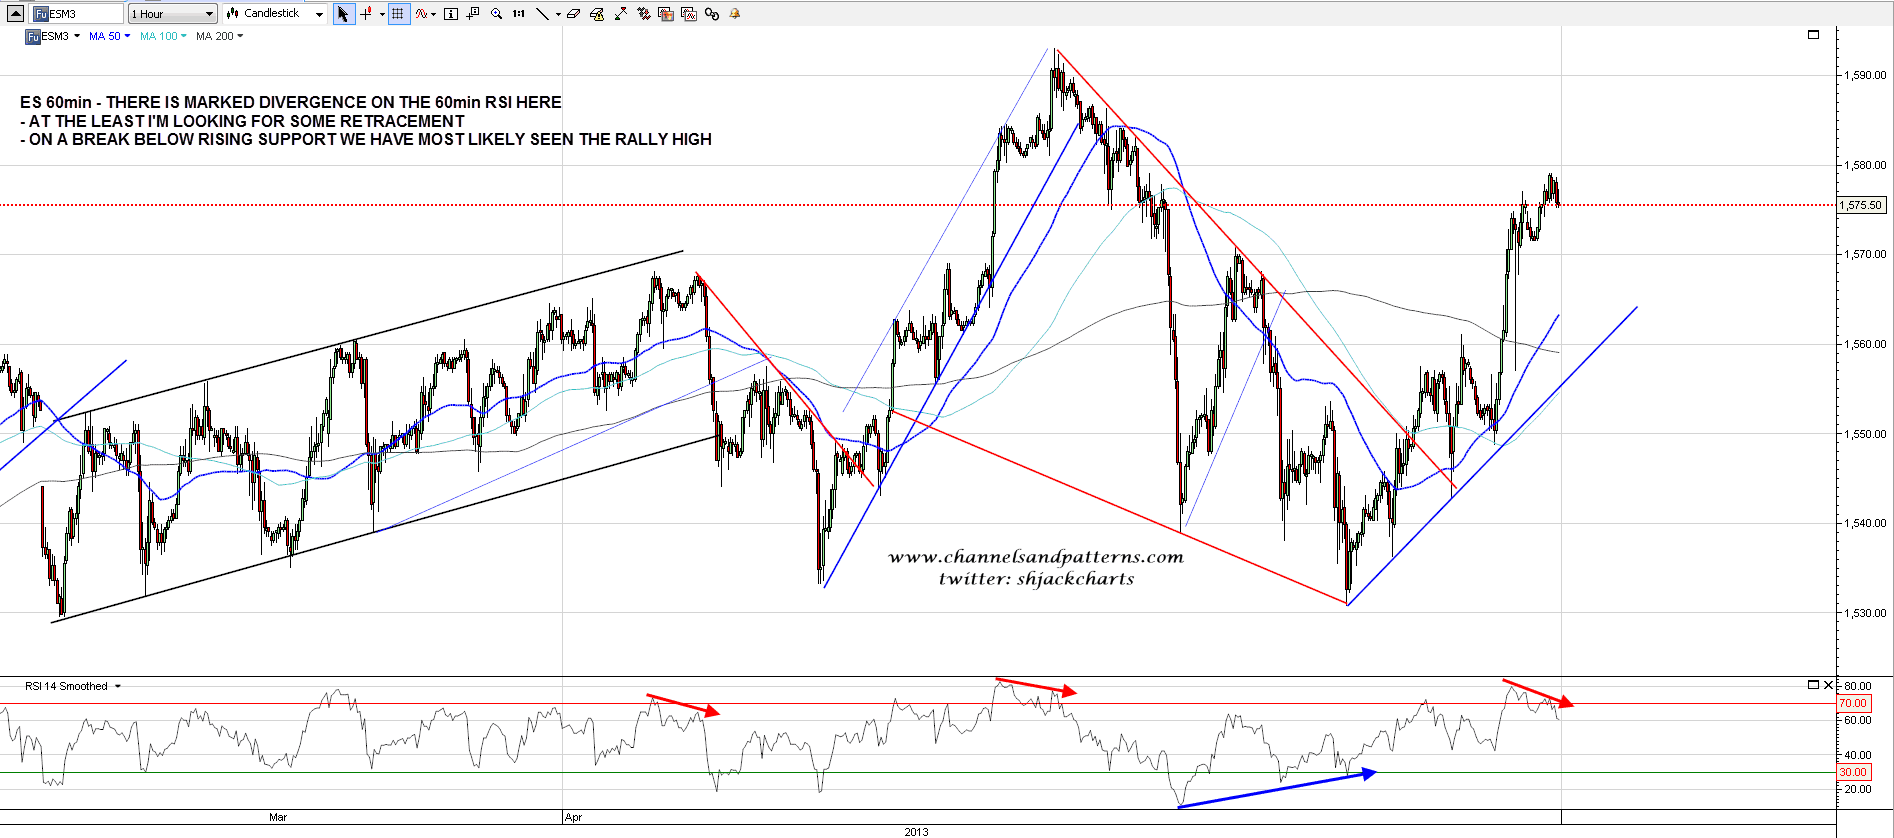
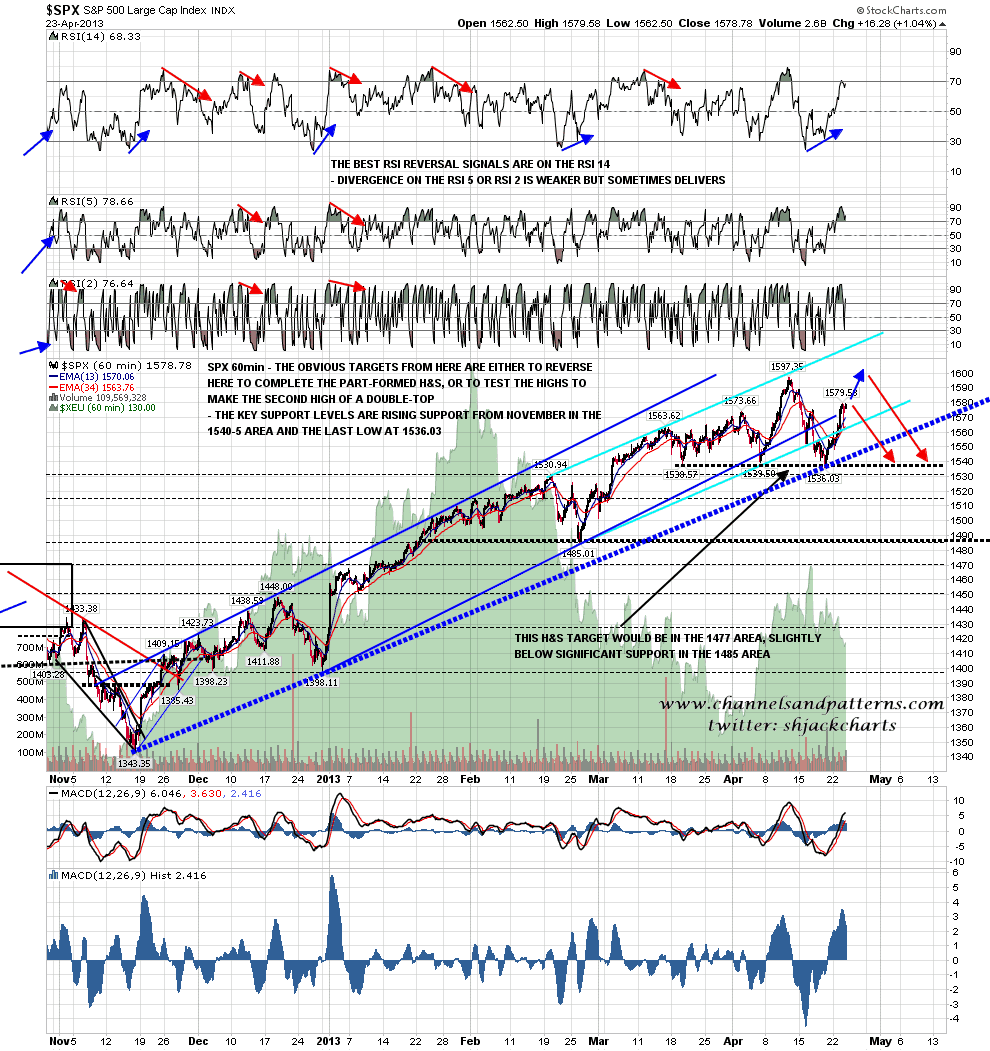
On the SPX 60min chart this could still go either way, and I have marked in a possible reversal here for the H&S option, and the retest of the highs for the double-top option. The key support levels on SPX are rising support from last week’s low in the 1562.5 area, rising support from November in the 1540-5 area, and last week’s low at 1536.03:
SPX broke well above the daily middle bollinger band yesterday and I would normally expect to see the upper bollinger band tested after a move of this size above the middle band. The upper bollinger band is now at 1592:

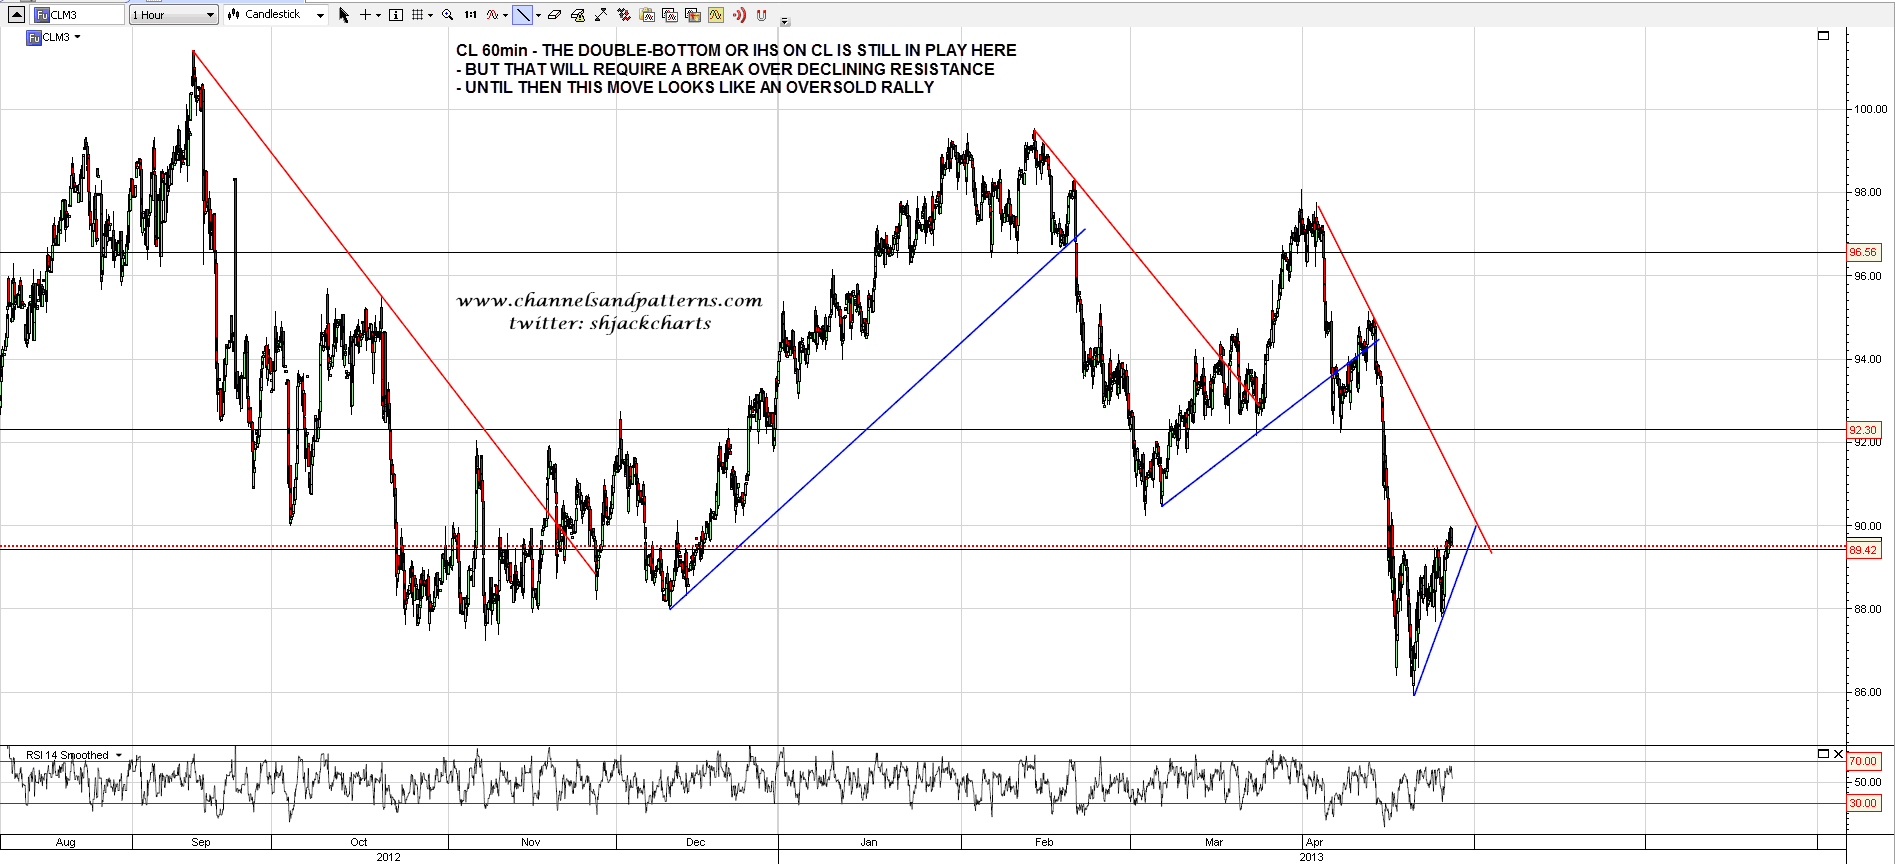
CL has broken slightly above the possible bottoming pattern, which could be read as either a double-bottom or an IHS. I’m doubtful now about either of these playing out unless we see CL break back above declining resistance, now in the 91 area:
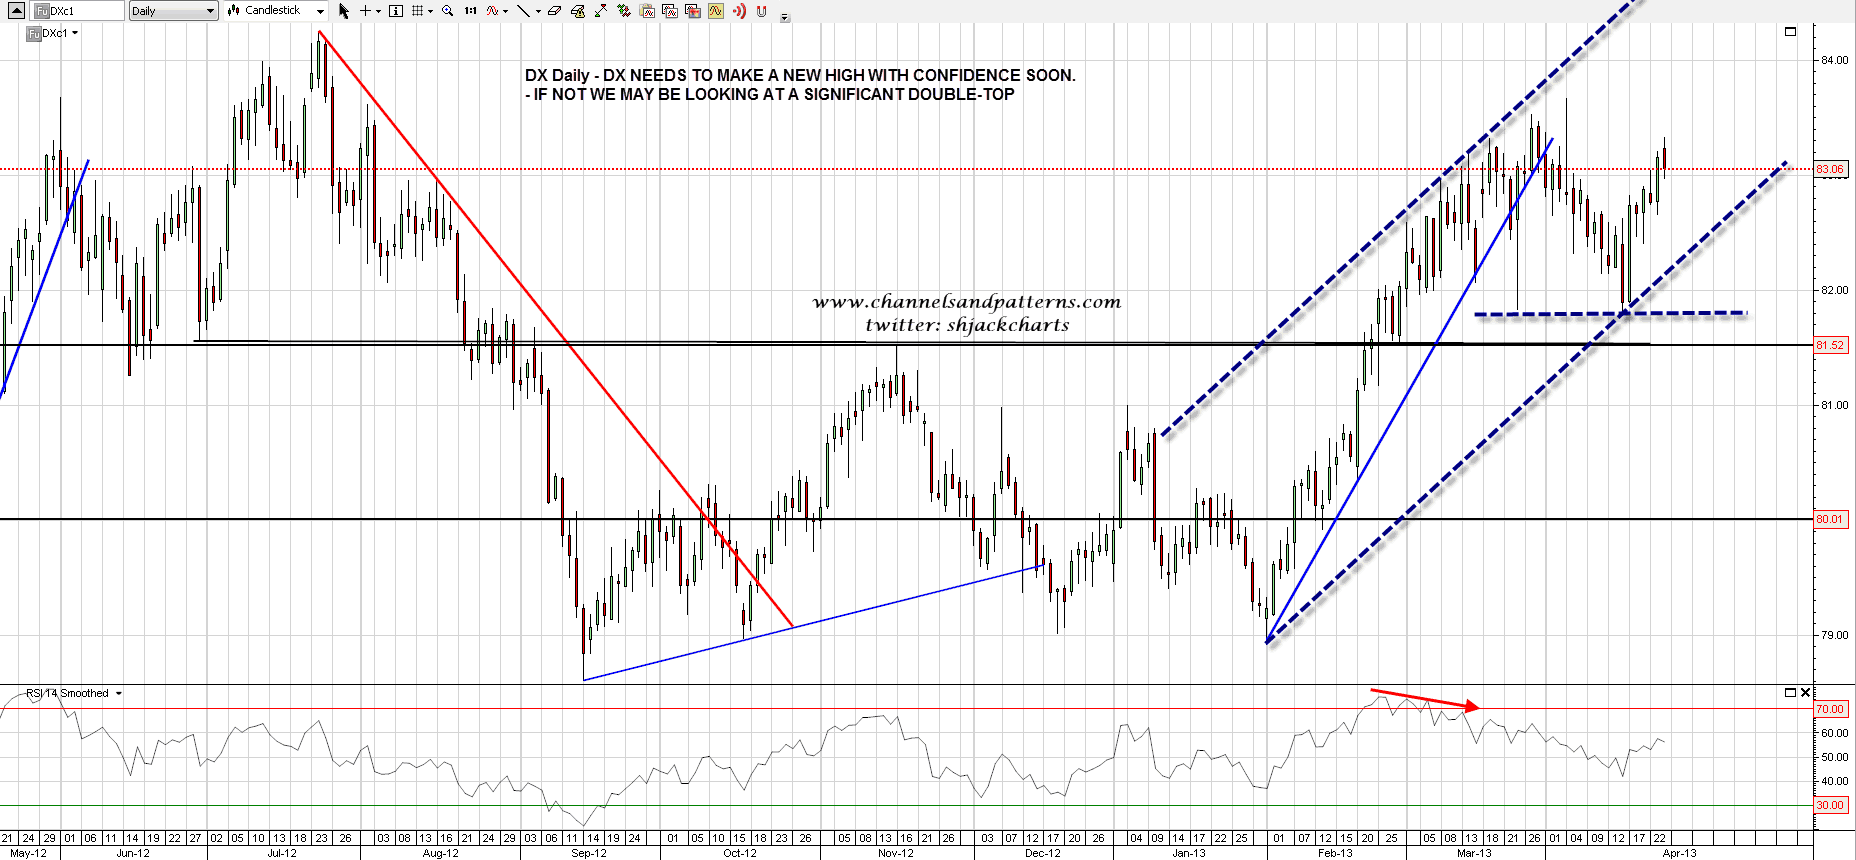
EURUSD is trading sideways and there’s not much to show there. Instead I’ll show the DX daily chart, which needs a break to new highs soon to eliminate the possibility that a significant double top is being made:
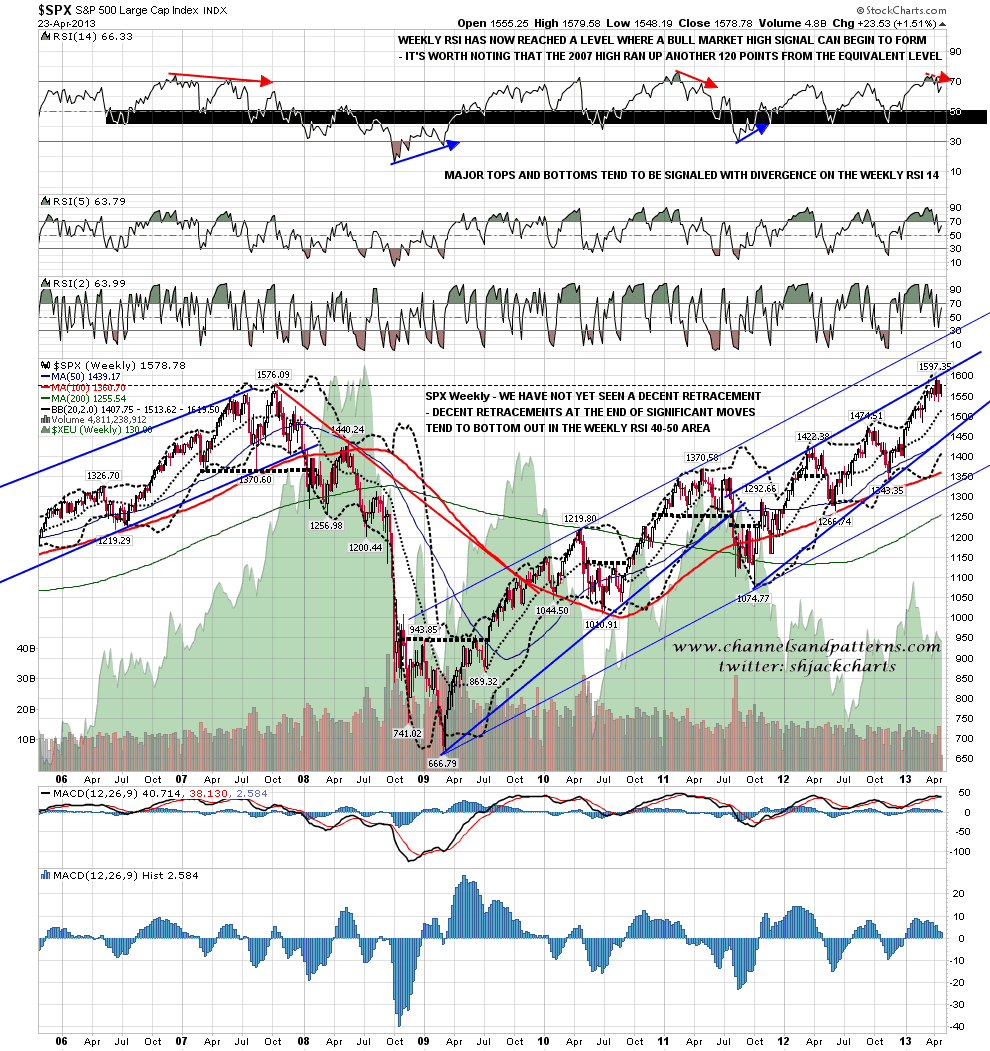
My last two charts today are two thought-provoking charts of SPX I’ve been looking at this morning. The first is the SPX weekly chart showing, among other things, the RSI setups for the last two bull market tops. The first thing to note from there is that there has not been a move under the 70 level from overbought that has recovered back to 70 in the last eight years without first testing the 40-50 area on RSI, which is the usual level low area on a significant retracement within a cyclical bull market. Obviously it goes lower in a cyclical bear market. The second thing to note is that while the negative current RSI divergence is small compared to the two bull market highs on this chart, there is noticeable negative RSI divergence. That is suggesting at least a possibility that we are looking at a cyclical bull market high here, though I’m doubtful about that for other reasons:
The second chart to close with today is a chart of SPX since 1980 with the 30yr treasuries market in the background. I have drawn trendlines through the major highs and lows on SPX over the last few years and the effect is striking to say the least. SPX has potentially very significant trendline resistance here:

These are just musings of course but the setup is interesting. Short term today I am looking for significant retracement on ES. Trendline support is currently at 1562.5 SPX and 1556 ES. If those trendlines hold then the path is open to test the highs, if they break then this rally high is most likely in and I’ll be looking for a test of last week’s lows. Credible reports that the White House had been bombed and Obama was injured in the blast was worth only a fifteen point drop yesterday, we may need Ben Bernanke to stub his toe to fall more than that today 🙂
