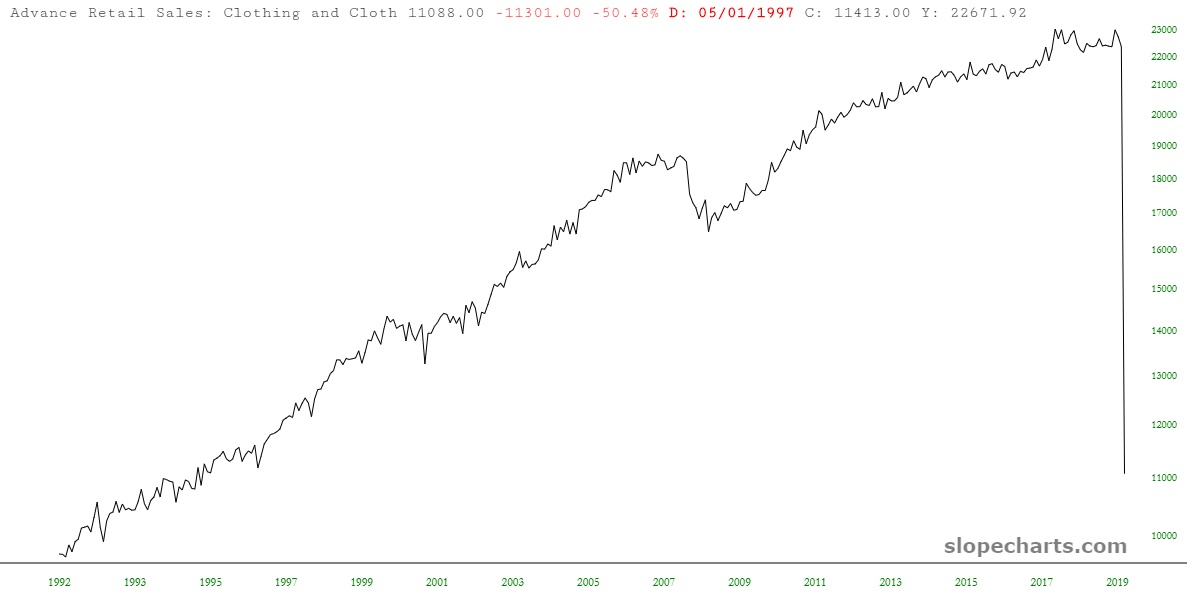
If you want to see the shutdown in a single chart, here it is: the retail sales of clothing on a monthly basis over the past thirty years. Here’s a fun game: try to spot when the economy closed. Please note that the nearly vertical line at the right side of the graph is not part of the chart grid.