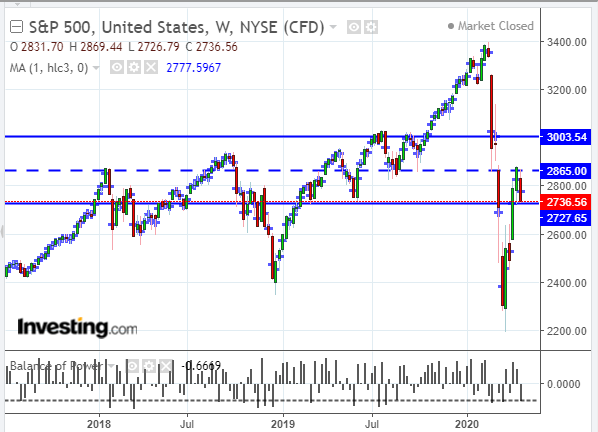
Shown on the following weekly chart of the S&P 500 Index (SPX) is a one-period moving average (hlc/3) in the form of a blue cross.
As such, each cross represents weekly support and resistance levels. I’ve chosen to highlight a zone/range taken from the moving average from the week of March 2 (resistance at 3003.54) to the week of April 6 (support at 2727.65). The midway level is 2865.
The Balance of Power (BOP) currently lies with the sellers on this weekly timeframe.
If price rallies and holds above 2865, look for the BOP to break and hold above the zero level, as a potential confirmation that buyers may be serious about taking the SPX to higher levels to, at least, 3003.54, or higher.

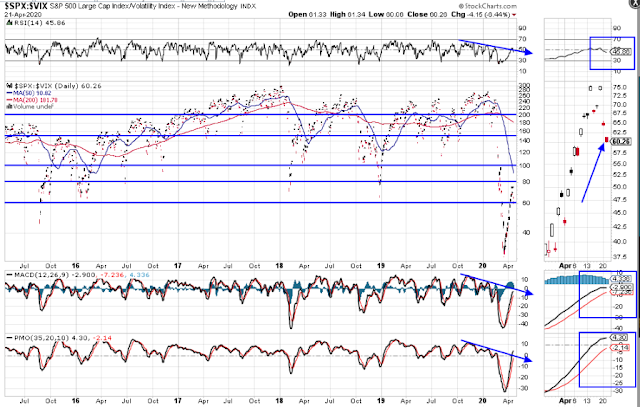
As I mentioned in my post of April 15, 60.00 represents a significant support level for the SPX:VIX ratio, as shown on the following daily ratio chart.
At that time, a price of 2750 for the SPX seemed to be tied to the 60.00 level…both critical levels in the battle between bulls and bears, in the near term.
The ratio price has fallen back and closed just above 60.00 on Tuesday. Furthermore, Tuesday’s SPX closing price is 2736.56.
A break and hold below 60.00, once again, could see the SPX plunge to a new low…below that made on March 23 (2191.86).
On the latest ratio rally, the RSI broke above its downtrend, the MACD histogram made a new swing high, and the PMO also broke above its downtrend. Any SPX rally should be accompanied by the reclamation of the 50.00 level on the RSI, higher histogram bars on the MACD, and a higher PMO level.
Under such a scenario, should the SPX break and hold above 2865, look for the ratio to break and hold above 80.00. Furthermore, as I mentioned above, watch for the BOP to break and hold above the zero level, as a potential confirmation that buyers may be serious about taking the SPX to higher levels to, at least, 3003.54, or higher.


