
After the violent rally on Thursday and Friday next week the real question here is whether a significant low has been made. There are some signs that might be the case.
On the SPX daily chart the low saw a spike down through the 3sd lower band, generally a good indicator for at least a strong rally, there are possible weekly RSI 5 buy signals brewing on SPX and Dow, a decent looking falling wedge on Dow that looks like a bull flag. That amounts to a definite maybe, though even if the all time high on SPX is retested next, the odds favor at least some more downside afterwards, but I’ll be looking at that in my next post.
SPX weekly chart:
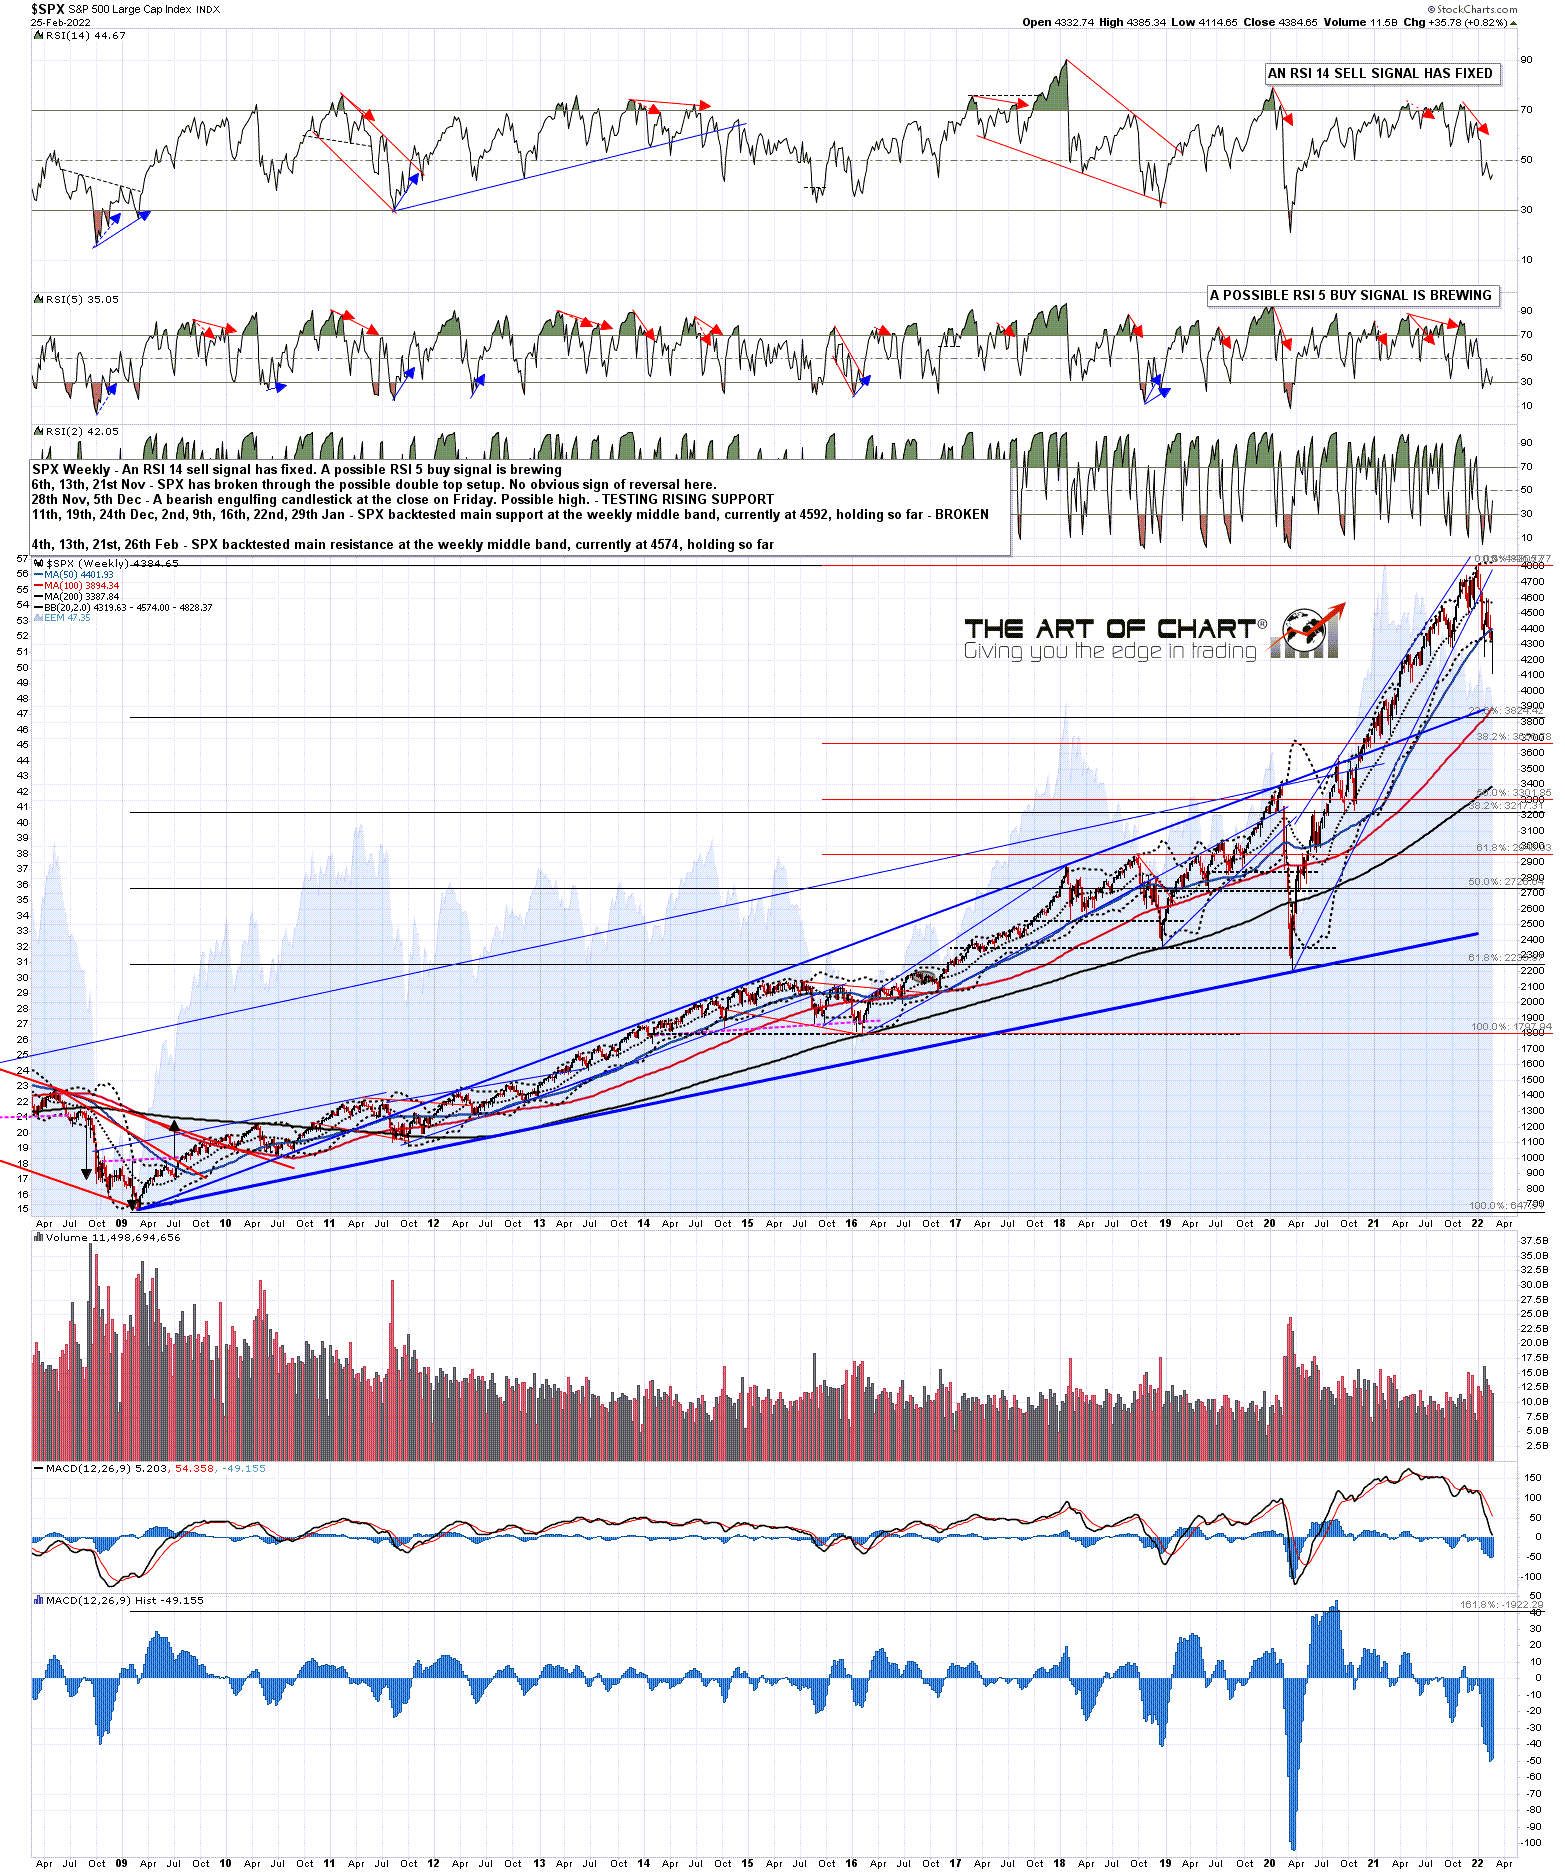
In the short term SPX broke back over the 5dma, so SPX is back on the Three Day Rule. The Three Day Rule states that on a break back over the 5dma after a decline of more than 2%, the SPX must hold above the 5dma on the next two daily closes or there should then be a retest of the preceding low (4114.65 here) before there is a full reversal of the retracement back into the prior high (at the all time high here).
Today would be day two, and a daily close back below the 5dma, currently at 4310.50, would have to be strong enough to be an obvious break below rather than just a close on the 5dma. On that basis this stat has not seen a fail since 2007, apart from two very marginal higher lows when triangles were forming, and has delivered twice already since the all time high at the start of 2022.
SPX daily 5dma chart:

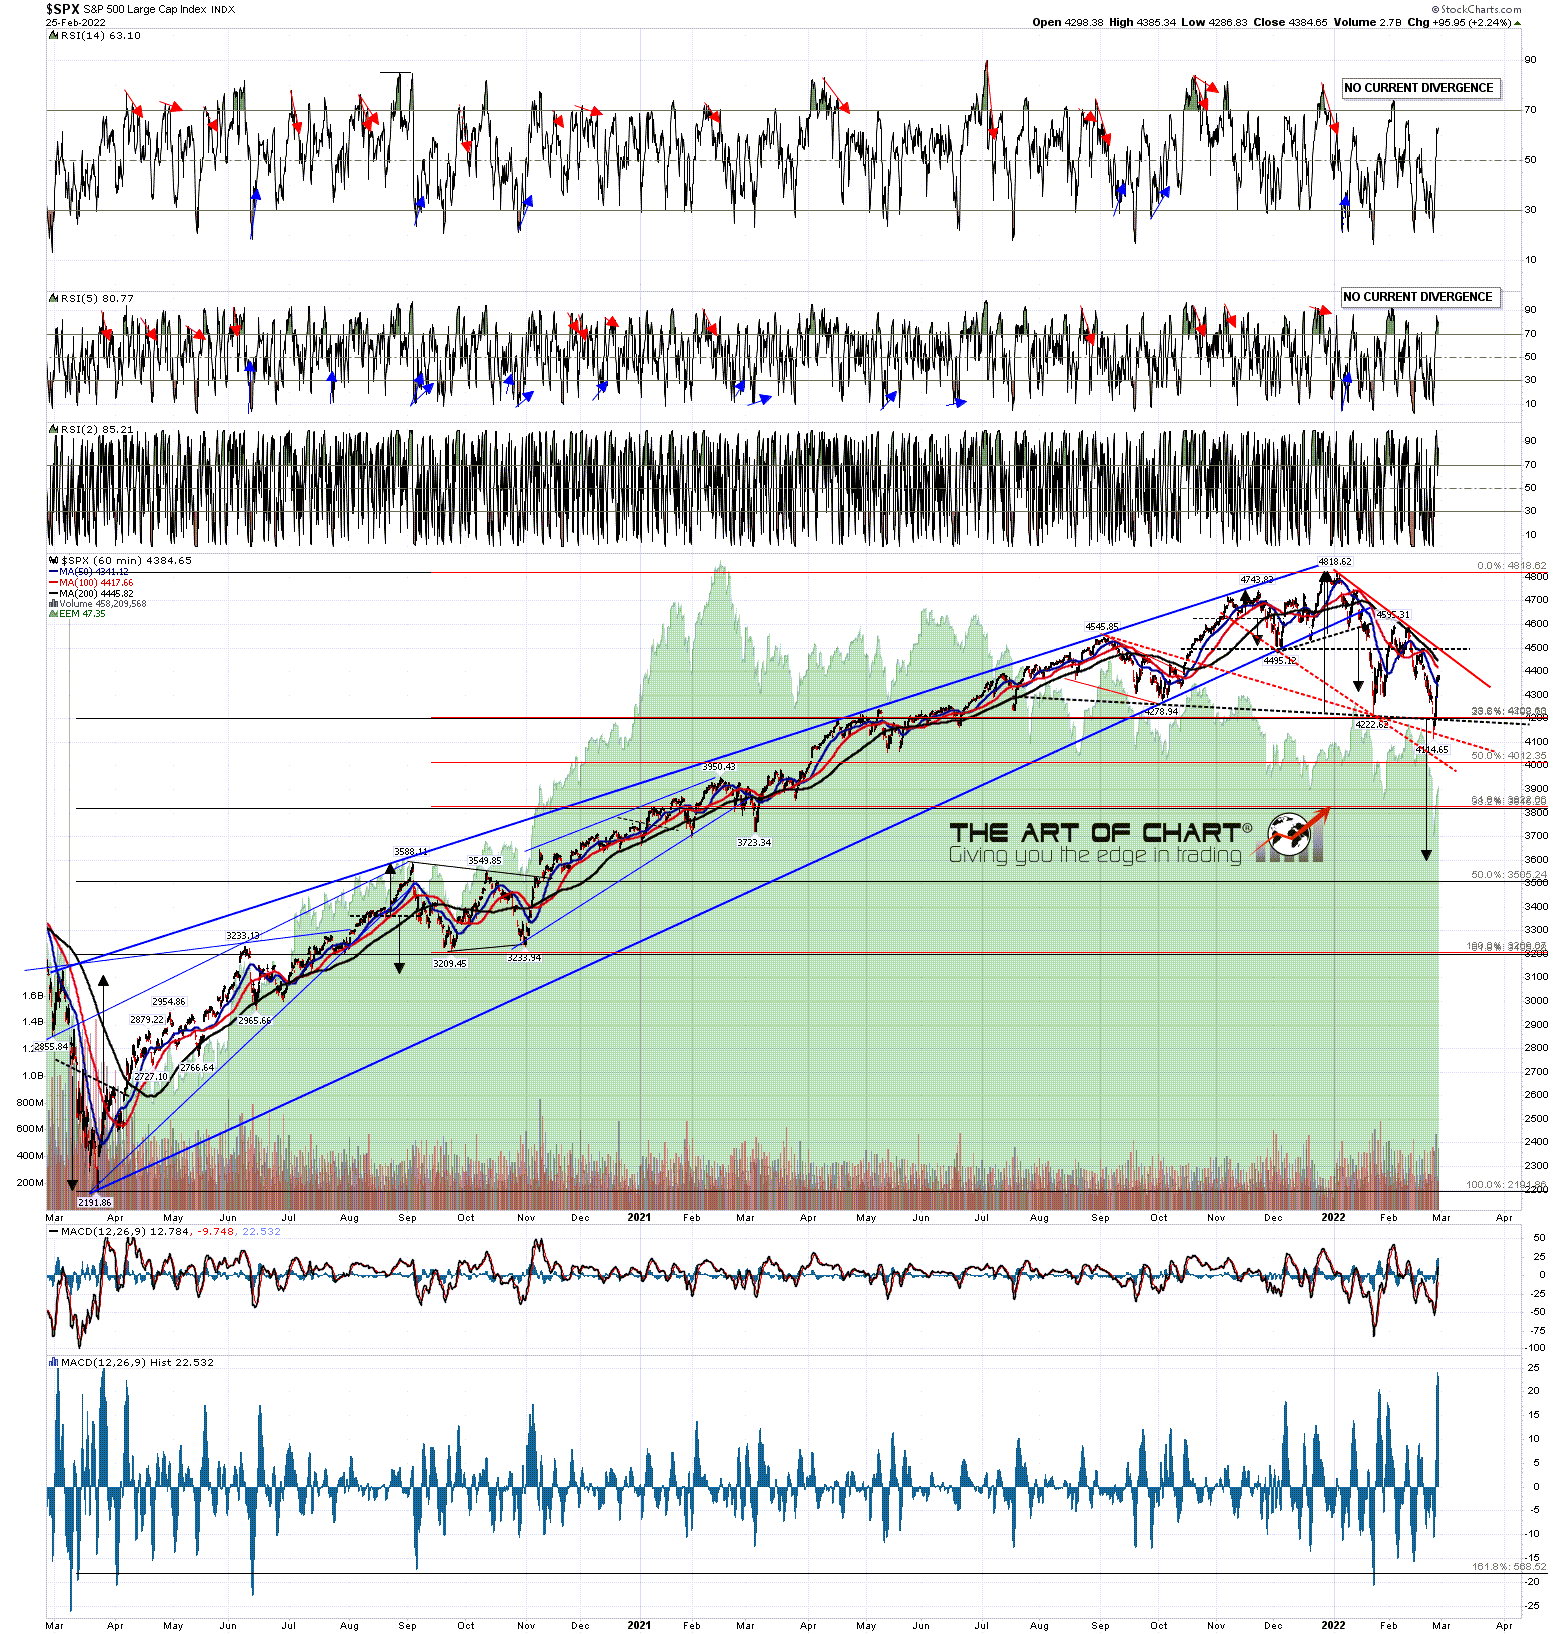
On the SPX hourly chart there is a possible falling wedge established that would be confirmed as a likely bull flag wedge on a break back over declining resistance in the 4500 area.
If SPX goes lower then there is a better (likely still bull flag) channel support now in the 4000-10 area.
SPX 60min chart:
There is a very similar setup on NDX with trendline resistance now in the 14400 area and possible channel support now in the 12350 area.
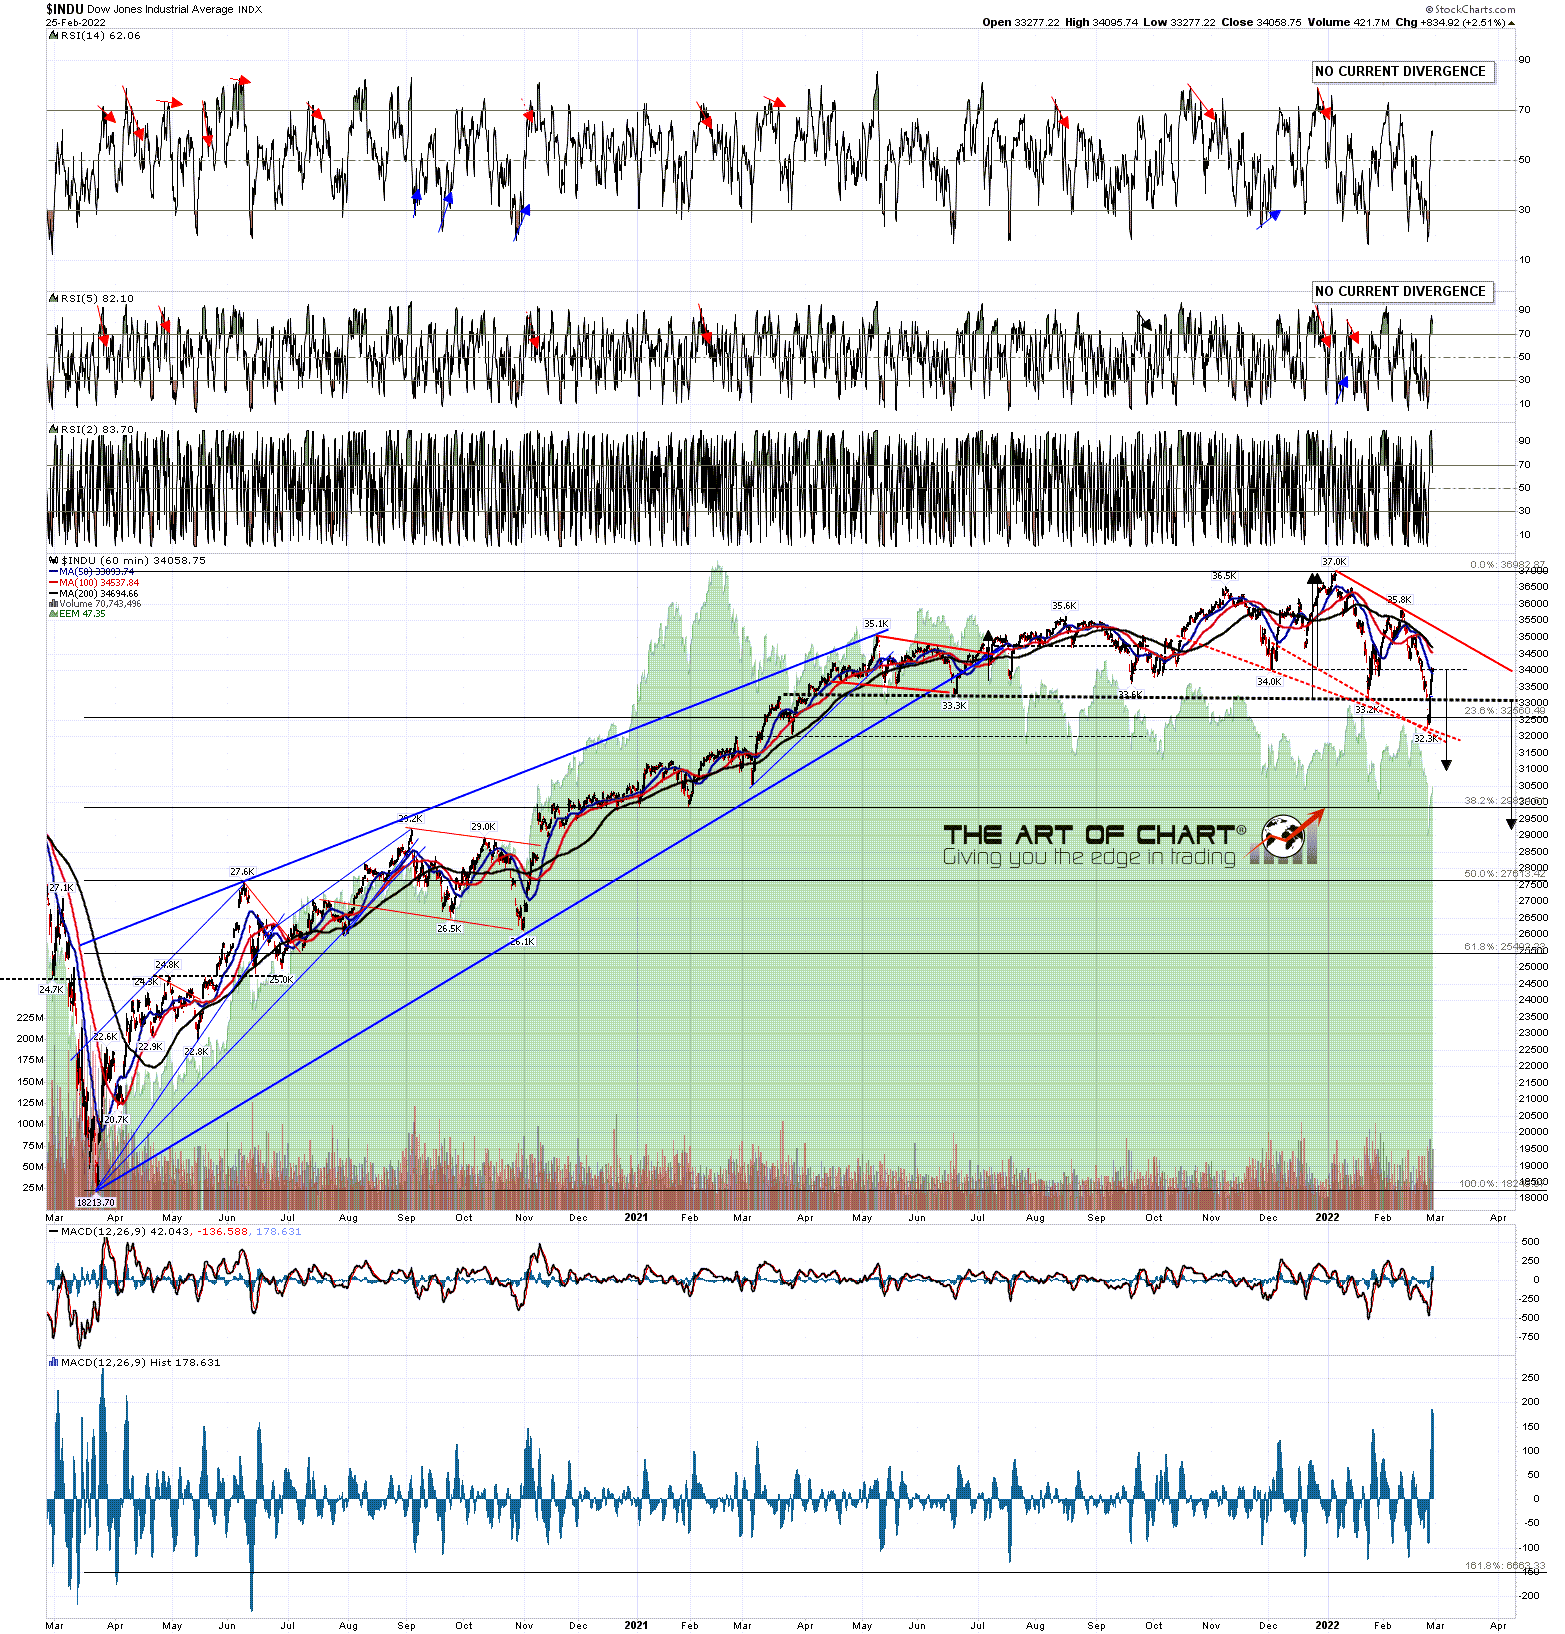
On the Dow chart there is already a very decent looking falling wedge established and the low may already be in.
INDU 60min chart:
The Dow futures hourly chart is showing something very interesting though, with a high quality IHS that may be forming, having made an ideal right shoulder low overnight. If YM breaks over and converts the neckline to support that would be a significant indicator that the low may already be in.
YM Mar 60min chart:

I’m keeping an open mind as to whether a significant low has been made on equity indices, but I would say that if a lower low is coming next, there is a good chance that we will see SPX deliver a clear daily close back below the 5dma today or tomorrow, and that the lower low would likely be delivered before Tuesday next week.
We are doing our Monthly free public Chart Chat at theartofchart.net at 4pm EST next Sunday 6th March, covering equity indices, commodities, bonds etc. If you’d like to attend you can register for that here or on our March Free Webinars page.
Our high end options service Paragon Options started the year strong with a $47,000 profit trading ES in January. We are looking at taking on up to ten new subscribers this month and if you’d like to sign up for a free trial you can do that here.
