
There are four months left in the remainder of 2023. We are experiencing the first red month since February and, not to put too much pressure, this week has the potential to determine the direction for the rest of the year.
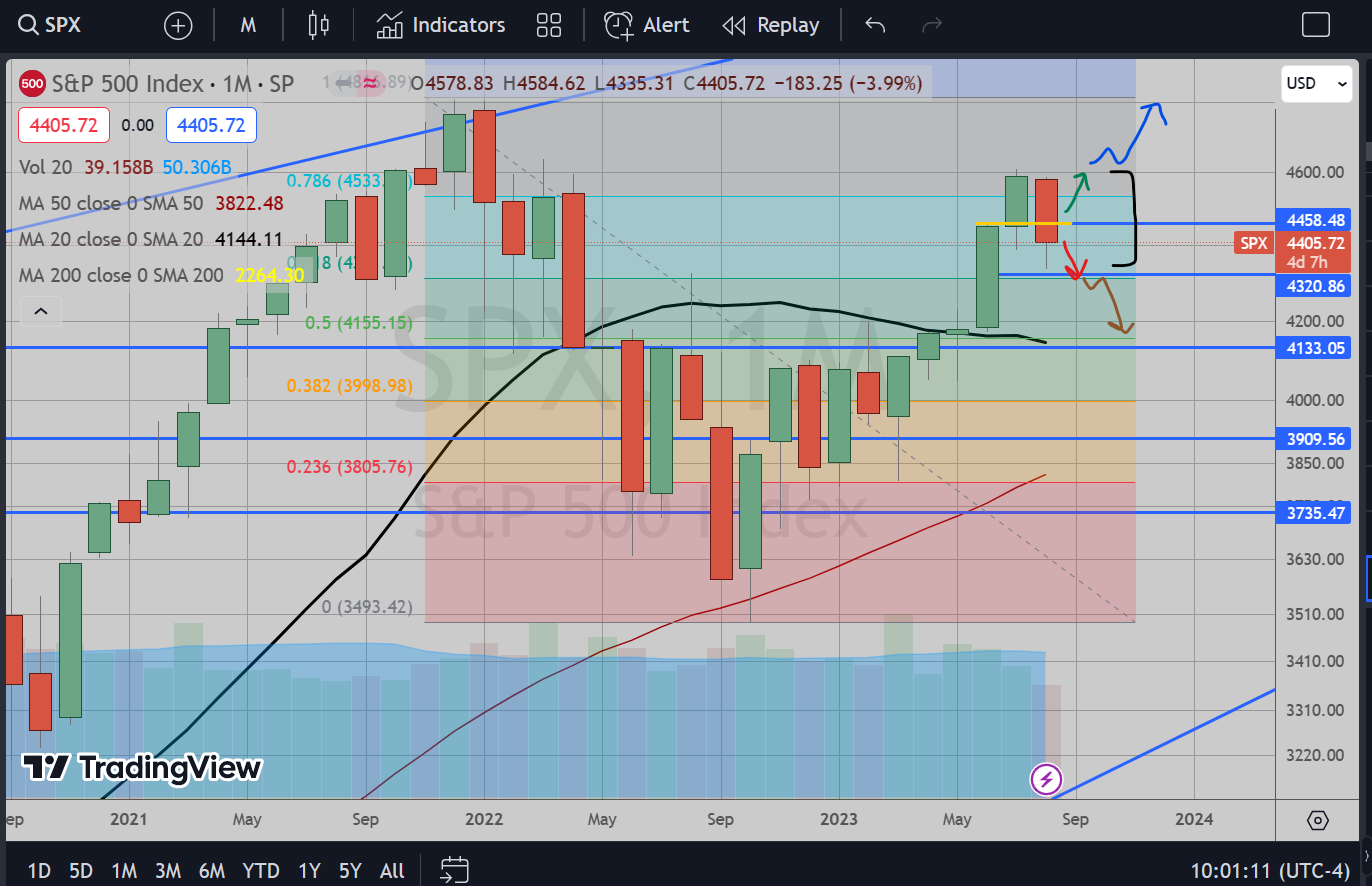
On the SPX monthly chart, we have this nice potentially reversing red bar. From a bearish perspective, I’d like to see the month close on Thursday anywhere here or lower around 4400. The 4450 spot specifically is incredibly important to close beneath if the bearish case has any remaining sway. If the month closes above there, then September has an opportunity to again squeeze shorts, start testing 4600 at which point I don’t think would hold as resistance this time around.
If we break upside then we have potential to get to new highs for the year (I feel like that Fundstrat guy when I talk like this. Feels gross). However, a weak close for the month here or lower gives a lot of bearish fuel to scare away investors into exiting positions for the remainder of the year, take their profits they made on the past 5 months and huddle down until they get better prices to get long again. So a weak close here would potentially yield a September swoon to retest 4160-4180. After that, well, let’s cross that bridge when we get there.
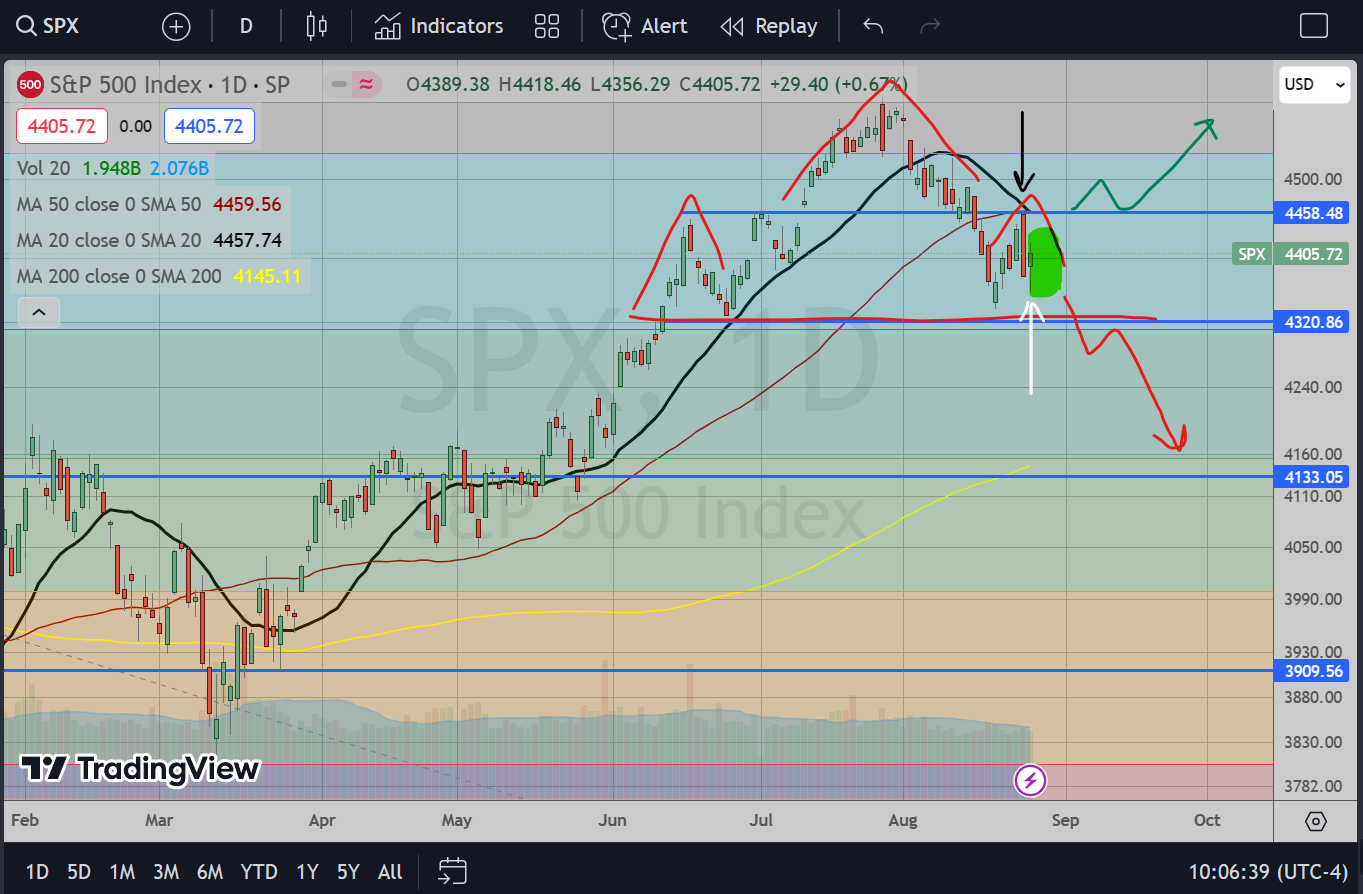
The S&P 500 daily chart provides some clarity on the developing pattern. We are in this little range now between support and resistance from June (the resistance now is support from July). This is helping to form a potential Head & Shoulders pattern with the right shoulder exactly at that 4450-4460 area. This is another reason 4450 is a hugely important spot. If this resistance fails to the upside then this H&S pattern is broken and all shorts from the beginning of August will start exiting and squeezing us back up again.
However, a break beneath that 4300-4330 line would complete the H&S topping pattern get us that September weakness at which I am salivating. The very short-term action over the next 5 trading days will be telling (highlighted green zone between 4360 and 4430).
You’ll notice I also highlighted some interesting action with a black arrow and white arrow, insights into which could provide short-term direction as well. Leading up to the black arrow was a lot of bullish buying off of 4330 area into NVDA earnings. I suppose the bulls thought NVDA and their expected AI earnings would again propel this entire market back to new heights.
In a way they were right as NVDA indeed did gap up hard and dragged up the rest of the tech stocks with it. It managed to drag up the SPX directly underneath this 4460 spot which, to my delight, provided one of the best short-term risk:reward shorting opportunity pricing in a long time (from a technical standpoint).
Thursday’s strong open quickly deteriorated and collapsed quite nicely. From there, bears rejoiced and were looking for more into Friday’s Jackson Hole speech from Powell (white arrow). What is interesting is that up until 11am, the weakness was broad and the entire market seemed to be under pressure since Powell’s speech was more of the same. I am sure every bear, including myself, was looking for the breakdown of 4330. However, once the London markets closed (not sure why that ever has any effect on our market, but it does seem to have some sort of predictive power in terms of reversals), the market bounced and finished strong off the lows in a choppy 5 hours into the close. That failure to drop leaves me uneasy as a short-term bear going into this week.
So, just giving my long train of thought on how to interpret and prepare for trading the next 5 days. Basically, watch those resistance and support zones. I am treating this zone as a short-term range potential until one of them breaks.
It is important to remember that we are still in a summer trade and people are on their last vacations until after Labor Day. I’ll be looking for quick drops into 4330 zone as support, but will get bought up in light volume and drift choppily back up. I’ll then look for resistance at 4420 (not shown, but look at shorter term charts such as hourly or 4-hour). If this breaks up then I’ll watch for the retest at 4450 which should hold and reject into the end of the month Thursday. If we break up then I’d get flat, wait for some confirmation upwards and I guess get long into the end of the year.
I’ll end with this. Take note that I specifically did not give a scenario where we stick within this range between 4300 and 4450 through the end of the year (or even close back near here). I simply don’t believe investors or institutions are going to range after summer is over. Decisions will be made to either lean into this bull market story and add in or simply get out and take profits over the next 4 months. As such, short-term action and levels will determine direction for the year. So it’s time to get into position to get lucky either way. Best of luck in trading this week everyone.
